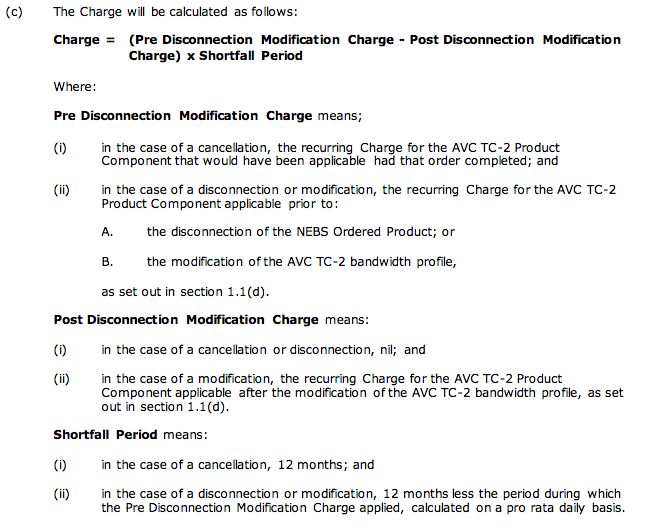
But will lock you in for 12 months if the existing copper line isn’t up to scratch
The company responsible for building the National Broadband Network, nbn, will begin offering line remediation to business services unable to reach their committed speeds over the copper network.
Business level services delivered over Traffic Class 2 (TC-2) have a committed information rate (CIR) which effectively guarantees a connection’s transfer rate. Typical residential services are provisioned over Traffic Class 4, which has a peak information rate (PIR) describing the “up to” transfer rate achievable over the line.
The company is already offering TC-2 services over its FTTN and FTTB network with symmetrical transfer speeds of 5, 10 or 20 Mbps. However, according to the current Wholesale Broadband Agreement (WBA), the company is currently not committing to its Committed Information Rate — stating:
“the actual Information Rate experienced by Customer, Downstream Customer or the relevant End User, may each be significantly less than the downstream CIR and upstream CIR of the bandwidth profile ordered by Customer in respect of the relevant Ordered Product”
According to the revised WBA on its website, the company will enable customers to submit a trouble ticket to remediate the copper line. However, nbn will also require the end user to take up the service for at least 12 months or will have to pay an early disconnection or modification fee.
NBN will charge an early termination or modification fee if customers had their business line remediated
Increased FTTN performance objectives
nbn is also increasing its network availability operational target on the FTTN Network from 99.70% to 99.80%. The agreement states that “operational targets are non-binding and aspirational”.
The new wholesale broadband agreement will become effective in early December 2016.
Analysis: Some areas delayed by up to 8 months, with 290k premises delayed by at least a month
The company responsible for building the National Broadband Network has updated its rollout schedule, revealing wide ranging delays of over a month in 105 multi-technology mix (MTM) rollout areas around Australia, affecting around 290,000 premises.
These rollout areas predominantly uses the Coalition’s preferred Fibre to the Node (FTTN) technology, where the company rolls out fibre to the neighbourhood and reconnects with the existing copper to the home. Despite promising rollouts using the FTTN technology to be faster to complete, the company had reportedly been facing issues including slow rollout design approvals from power companies who will have to power the nodes in the streets. The reasoning behind the latest set of delays is unknown.
The areas worst affected by the delay are Cygnet in Tasmania and Mornington in Victoria, with a delay of 8 months shifting completion dates from late 2016 to mid 2017. The is followed closely by another rollout area in Mornington, Victoria as well as South Hobart and Margate in Tasmania and Garfield in Victoria with delays of between 6 and 7 months.
The rollout in Fletcher, NSW and suburbs near Claremont, Hobart, Tasmania have been set back by around 5 months. Another 8 rollout areas, covering around 22,400 premises in parts of Victoria, Queensland, Western Australia, Tasmania and New South Wales have been delayed by 4 months.
For a full list of affected areas, refer to the table below.
Another 22 areas, not listed below, were delayed by less than a month.
Service Area Module (SAM)
Locality
May completion date
June completion date
# of months delayed
Approx number of premises affected
7CYE-01
Cygnet
Oct-2016
Jun-2017
8
600
3MOR-02
Mornington
12-Aug-2016
Apr-2017
8
3400
3MOR-05
Mornington
Sep-2016
Apr-2017
7
2300
7HOB-12
South Hobart, Wellington Park, Fern Tree
Oct-2016
Apr-2017
6
1000
7MGT-01
Electrona, Lower Snug, Margate, Snug, Coningham
Dec-2016
Jun-2017
6
2000
3GAR-01
Garfield, Longwarry, Bunyip
05-Aug-2016
Feb-2017
6
2300
2NLT-01
Fletcher
Oct-2016
Mar-2017
5
3700
7NWT-02
Chigwell, Berriedale
Oct-2016
Mar-2017
5
2800
3TAG-04
Traralgon
Oct-2016
Feb-2017
4
2600
4IGH-01
Ingham
Oct-2016
Feb-2017
4
3000
6RKH-01
Safety Bay, Rockingham
Sep-2016
Jan-2017
4
3100
6RKH-04
Rockingham, Safety Bay, Cooloongup
Sep-2016
Jan-2017
4
3500
6ARM-02
Cardup, Byford
Nov-2016
Mar-2017
4
4700
7BUI-04
Hillcrest, Montello, Park Grove, Parklands, Burnie
Emu Heights, Havenview, South Burnie, Wivenhoe, Burnie
Dec-2016
Feb-2017
2
1200
3TAG-03
Traralgon East, Traralgon
Sep-2016
Nov-2016
2
3100
4EDG-08
Kanimbla, Whitfield, Brinsmead
Sep-2016
Nov-2016
2
2600
4FRV-01
Norman Gardens
Sep-2016
Nov-2016
2
3300
7HOB-11
Moonah, New Town, Lenah Valley
Sep-2016
Nov-2016
2
3000
3WBO-01
Warrnambool
Sep-2016
Nov-2016
2
3700
7HOB-10
Sandy Bay
Oct-2016
Dec-2016
2
3000
2BUP-03
Doyalson, Wyee, Blue Haven
Nov-2016
Jan-2017
2
3100
2NRN-06
Harrington Park
Nov-2016
Jan-2017
2
1800
3RYE-01
Rye
Nov-2016
Jan-2017
2
4000
4BWE-01
Bowen
Nov-2016
Jan-2017
2
2200
5MIC-01
Millicent
Nov-2016
Jan-2017
2
2600
3CBR-64
Coburg North,Preston (Vic.),Reservoir (Vic.)
Sep-2016
Nov-2016
2
1200
2BUP-01
San Remo, Buff Point
05-Aug-2016
Oct-2016
2
3200
3COL-02
Colac East, Elliminyt, Colac
05-Aug-2016
Oct-2016
2
3900
2MAI-09
Maitland, Telarah, Lorn
15-Jul-2016
09-Sep-2016
2
3300
3WAN-01
Wangaratta
15-Jul-2016
09-Sep-2016
2
3000
2MAI-06
Bolwarra Heights, Largs, Mindaribba, Bolwarra
22-Jul-2016
16-Sep-2016
2
2200
2ALB-04
North Albury, Albury
05-Aug-2016
30-Sep-2016
2
3400
2AVA-02
Avalon
05-Aug-2016
30-Sep-2016
2
2900
2MAI-01
Windella, Rutherford
12-Aug-2016
30-Sep-2016
2
1000
3MOE-04
Yallourn North, Newborough
19-Aug-2016
Oct-2016
1
3300
2MSV-03
East Bowral, Bowral
15-Jul-2016
26-Aug-2016
1
3500
2ALB-03
West Albury, Albury
29-Jul-2016
09-Sep-2016
1
3700
3SHP-09
Kialla West, Kialla
29-Jul-2016
09-Sep-2016
1
1500
2MTT-01
Mittagong, Willow Vale, Braemar
12-Aug-2016
23-Sep-2016
1
2000
4EDG-07
Earlville, Mooroobool, Bayview Heights
26-Aug-2016
Oct-2016
1
3400
3WAN-02
Wangaratta
15-Jul-2016
19-Aug-2016
1
2900
3WGU-04
Drouin East, Drouin
22-Jul-2016
26-Aug-2016
1
3400
7DER-01
Devonport
05-Aug-2016
09-Sep-2016
1
1800
2ERN-03
Green Point, Erina
12-Aug-2016
16-Sep-2016
1
3200
2KTB-02
Leura, Medlow Bath, Katoomba
12-Aug-2016
16-Sep-2016
1
3400
3WGU-05
Drouin
19-Aug-2016
23-Sep-2016
1
2800
4NEW-06
Cranley, Gowrie Junction, Torrington, Wilsonton, Wilsonton Heights, Cotswold Hills
Dec-2016
Jan-2017
1
3300
2SHH-01
Shell Cove, Shellharbour, Dunmore
Jan-2017
Feb-2017
1
3000
2NRN-05
Narellan, Narellan Vale, Elderslie
Oct-2016
Nov-2016
1
2900
2PKE-05
Lake Heights, Berkeley
Oct-2016
Nov-2016
1
3900
5GPC-05
Pooraka, Para Hills West
Oct-2016
Nov-2016
1
3700
2PKE-02
Lake Heights, Warrawong, Cringila
Oct-2016
Nov-2016
1
3700
3LOR-20
Lorne
Oct-2016
Nov-2016
1
2500
3RMS-01
Romsey, Lancefield
Oct-2016
Nov-2016
1
2700
3SUN-01
Sunbury
Oct-2016
Nov-2016
1
3300
2NRN-03
Narellan Vale, Smeaton Grange, Harrington Park
Oct-2016
Nov-2016
1
3800
4BDA-20
Babinda
Oct-2016
Nov-2016
1
800
4FRV-03
Koongal, Lakes Creek, Nerimbera, Frenchville
Oct-2016
Nov-2016
1
4300
4SAR-01
Sarina
Oct-2016
Nov-2016
1
1900
6RKH-05
Waikiki, Cooloongup
Oct-2016
Nov-2016
1
3700
6RKH-03
East Rockingham, Hillman, Rockingham, Cooloongup
Dec-2016
Jan-2017
1
3300
6RKH-06
Waikiki, Safety Bay
Dec-2016
Jan-2017
1
3500
6RKH-08
Rockingham, Peron
Dec-2016
Jan-2017
1
3900
7CLT-01
Campbell Town
Jan-2017
Feb-2017
1
700
5GPC-07
Mawson Lakes
Jan-2017
Feb-2017
1
3600
3WDG-01
Wodonga, Leneva
Sep-2016
Oct-2016
1
2700
3WAN-03
Wangaratta, Waldara
Sep-2016
Oct-2016
1
1700
4NEW-09
Drayton, Harristown, Darling Heights
Sep-2016
Oct-2016
1
3100
7EXE-01
Exeter, Gravelly Beach, Lanena, Rosevears, Swan Point, Blackwall
Sep-2016
Oct-2016
1
900
4BUD-05
Palmwoods
Sep-2016
Oct-2016
1
2100
4ROT-01
Rockhampton City, Depot Hill
Sep-2016
Oct-2016
1
1400
4RED-01
Mount Cotton, Carbrook
Sep-2016
Oct-2016
1
3000
4SHF-01
Trinity Beach, Trinity Park, Kewarra Beach
Sep-2016
Oct-2016
1
1900
7NOL-01
Magra, New Norfolk, Lawitta
Sep-2016
Oct-2016
1
2900
5BDT-20
Bordertown
Nov-2016
Dec-2016
1
1600
7BIC-01
Bicheno
Nov-2016
Dec-2016
1
900
5BRR-01
Berri
Nov-2016
Dec-2016
1
2500
6ARM-01
Byford, Darling Downs, Haynes, Hilbert, Mount Richon, Wungong, Brookdale
Nov-2016
Dec-2016
1
4000
6ARM-04
Forrestdale, Haynes, Seville Grove, Armadale
Nov-2016
Dec-2016
1
3600
3MOE-01
Trafalgar, Moe
22-Jul-2016
19-Aug-2016
1
2700
6MDR-10
Erskine
27-May-2016
24-Jun-2016
1
2500
3PTO-05
Portarlington
15-Jul-2016
12-Aug-2016
1
2200
3PTO-06
St Leonards
15-Jul-2016
12-Aug-2016
1
2800
3OCG-02
Breamlea, Barwon Heads
22-Jul-2016
19-Aug-2016
1
2800
3SHP-10
Kialla
29-Jul-2016
26-Aug-2016
1
1300
7BUI-03
East Cam, Ocean Vista, Park Grove, Parklands, Shorewell Park, Cooee
Feb-2017
Mar-2017
1
2900
7ETD-02
Latrobe
Feb-2017
Mar-2017
1
2000
Analysis based on NBN Co’s rollout schedule, reproduced by Telstra on the Telstra Wholesale website. A variety of sources were checked to confirm this information.
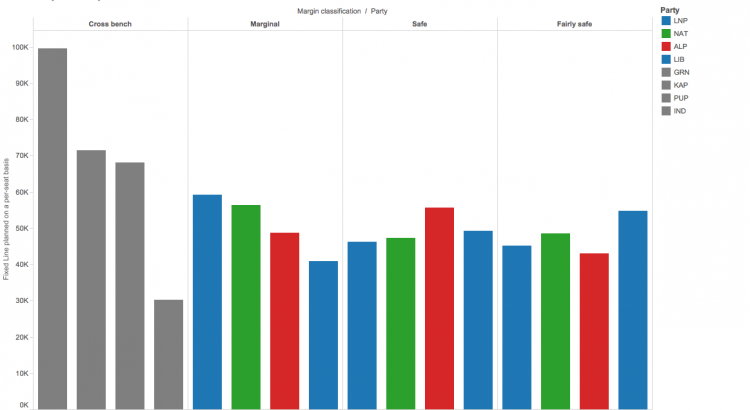
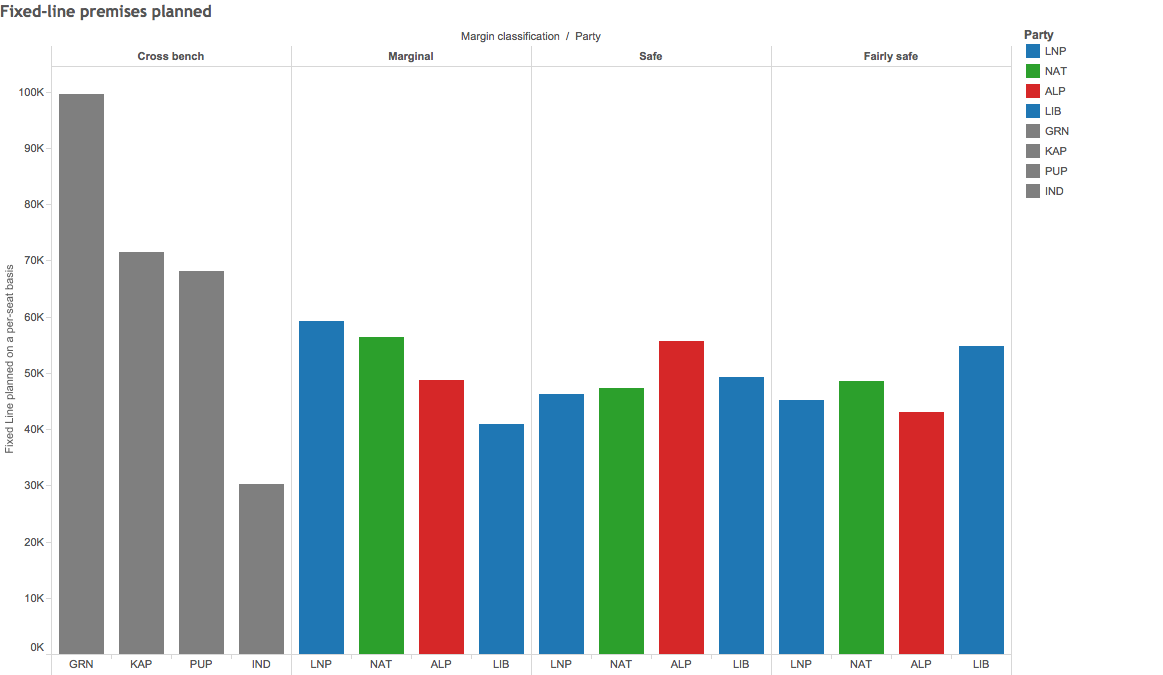
Rollout numbers are higher in the densely populated areas held by cross-bench and marginal LNP MPs.
Writer’s note, 20th Oct: A point of clarification. While the data does show on an averaged party-margin basis that seats of a few cross-bench MPs have a higher number of homes in the 3 year plan, this does not suggest a direct correlation between the two. As stated previously in the article, albeit possibly not clearly enough, the seats held by the Greens, KAP and PUP are generally more densely populated and thus, would tend to have higher rollout figures in the fixed-line 3 year plan.
Analysis of the nbn construction plan released last week shows that on an averaged per-electorate basis, seats held by cross-bench MPs Adam Bandt (Greens), Bob Katter (Katter Australian Party), Clive Palmer (Palmer United Party) and conservative LNP seats has the greatest number of premises scheduled to commence construction over the next 3 years. However, the majority of these seats are coincidentally located in the more densely populated areas of Australia.
By party margin on a per-electorate basis
Between now and September 2018, Adam Bandt’s electorate of Melbourne is expected to see 99,600 premises commence build. Bob Katter’s electorate of Kennedy is expected to see 71,500 premises commence build, followed by Clive Palmer’s electorate of Fairfax taking 68,200 premises into build by late 2018.
On a per-electorate basis (that is, the total number of premises divided by the number of seats held), marginal Liberal-National Party and Nationals Party seats come in at fourth and fifth with 59,233 and 56,300 premises expected to enter build respectively.
Party
Margin classification
Total planned fixed-line
Electorates under this category
Planned Fixed-line (per-electorate)*
GRN
Cross bench
99,600
1
99,600
KAP
Cross bench
71,500
1
71,500
PUP
Cross bench
68,200
1
68,200
LNP
Marginal
355,400
6
59,233
NAT
Marginal
56,300
1
56,300
ALP
Safe
836,200
15
55,747
LIB
Fairly safe
493,500
9
54,833
LIB
Safe
1,430,800
29
49,338
ALP
Marginal
1,413,400
29
48,738
NAT
Fairly safe
48,600
1
48,600
NAT
Safe
331,500
7
47,357
LNP
Safe
323,200
7
46,171
LNP
Fairly safe
406,200
9
45,133
ALP
Fairly safe
472,500
11
42,955
LIB
Marginal
819,500
20
40,975
IND
Cross bench
60,500
2
30,250
* the total number of premises in the plan to commence build (column 3), divided by the number of seats held within the party-margin category (column 4)
Graph showing planned premises in the 3 year rollout plan sorted by seat margin, normalised by dividing the number of premises by the number of seats held in each category
By electorate
However, the winning electorate is the electorate of Sydney – currently held by Labor MP Tanya Plibersek – with a total of 106,800 premises slated to commence build by late 2018. This is followed closely by Adam Bandt’s seat of Melbourne (99,600), Labor MP Melissa Parke’s marginal seat of Fremantle (94,700) and Labor MP Clare O’Neil’s seat of Hothan (92,000). The high number of premises in these areas is reflective of the dense population of these inner metropolitan centres.
Of the 150 federal electorates, only the electorate of Solomon – held by Country Liberal MP Natasha Griggs – has no fixed-line rollout plans. The electorate covers the greater Darwin area where NBN rollout is mostly completed or already underway.
Did we miss an opportunity to get an FTTP+HFC rollout? Figures from NBN’s stragegic review suggest a two-stage FTTN to G.Fast upgrade could now cost more than if we just stuck with FTTP
Even before they’ve switched on a single Fibre to the Node customer — nbn, the company responsible for building the National Broadband Network, has been busy spruiking their plans to trial and eventually upgrade Fibre to the Node to G.Fast technology to the media.
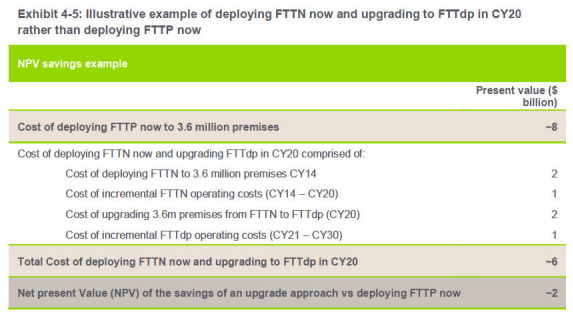
However, acccording to estimates made in the company’s Strategic Review, building the Fibre to the Node network now and upgrading to Fibre to the Distribution Point (FTTdp) using G.Fast technology would have saved a mere $2 billion dollars compared with a “radically redesigned” Fibre to the Premises rollout. Since then, blowouts in the Fibre to the Node rollout would have surpassed the said savings of $2 billion dollars.
Fibre to the Node: blowouts
The company had straight-out refused to publish a raw Fibre to the Node cost-per-premises figure in their Strategic Review. However, on page 101 of the Strategic Review, the company estimated that it will cost around $2 billion dollars to roll out 3.6 million premises using Fibre to the Node architecture. This equates to approximately $555 — $833 per premises (assuming range of $2 — $3 billion dollars divided by 3.6 million premises).
The FTTdp upgrade cost breakdown in the Strategic Review
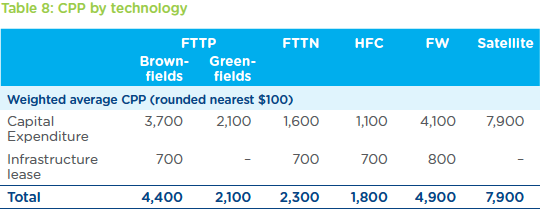
According to the latest 2016 corporate plan, this cost has blown out to $1,600 per premises or a net increase of $767 — $1,045 per premises (excluding infrastructure lease which was not attributed to CPP in original calculations).
Current cost-per-premises projections as stated NBN’s 2016 corporate plan
nbn has also increased the FTTN/B/dp footprint from 3.6 million premises to 4.5 million. From Fibre to the Node cost per premises alone, this has attributed to a net blowout of between $3.5 to $4.7 billion dollars from Strategic Review cost estimates — potentially overriding the savings of $2 billion envisaged in the VDSL–G.Fast upgrade path.
Fibre to the Premises: better than expected?
The issue with this is of course, comparing FTTN costs with costs that we’d never know. We will never know exactly how much a “radically redesigned” FTTP rollout would have costed — but we can make estimates:
Comparing NBN’s estimates for Fibre to the Premises (Revised Outlook) in the Strategic Review with current Fibre to the Premises, figures shows they had over-estimated the capital expenditure of the FTTP rollout by about 11%: ~$4,100 in the Strategic Review ($1,997 for LNDN plus $2,100 for the activation, equating to $4,097 — see pages 62 and 64 of SR) vs $3,700 in the 2016 Corporate Plan. This suggests better-than-expected costs in the Fibre to the Premises rollout costs.
But it’s too late anyway
But unfortunately, the company has already invested billions into developing the so-called Multi-Technology Mix and has a task to rollout Fibre to the Node thanks much to Government policy. These are costs that taxpayers will never be able to recover, meaning we may have missed another opportunity to rollout FTTP in the majority of the now-FTTN footprint.
As the cost of the copper-based network increases, the comparative investment in those technologies become less attractive. Speed and capacity upgrades require installing more active equipment in the field and also extending fibre closer to the home. Thus, incremental upgrades and ongoing operating expenses on a copper-based broadband network is far greater than those on a fibre-based network where only tail equipment has to be swapped out.
If the savings in building a copper-based network are relatively small in initial capital expenditure — eventually, the economics will reverse and bite back.
Since Fibre to the Node will now span the majority of the network, the only logical upgrade path for those areas would now be FTTdp because of all the capital costs sunken into rolling out FTTN. But don’t think for a second that it will be actually cheaper than rolling out fibre all the way to the home in the first place.
In summary, if the Strategic Review’s figures are to be trusted, we may have missed yet another opportunity to get a FTTP network, albeit “radically redesigned” in nbn‘s vernacular. Calculations suggest it could have cost less than what the current FTTN rollout plus a G.Fast upgrade in 2020 will cost. Plus, the company has also proved at almost every instant that they had underestimated any non-FTTP costs in the strategic review and helpfully inflated any FTTP costs higher than actuals.
What are your thoughts? The analysis, of course, makes assumptions based on the available data. I think it’s a real pity how it seems time after time, taxpayer’s money ends up being wasted based on a false premise in a rushed report.
nbn, the company responsible for building the National Broadband Network, confirmed the delay to technology publication Delimiter. The company says they have deliberately chosen a slower activation approach as it “allows us to test our own processes and systems and to identify any issues along the way.”
I suggest you read Renai’s article to get the full spiel from nbn™.
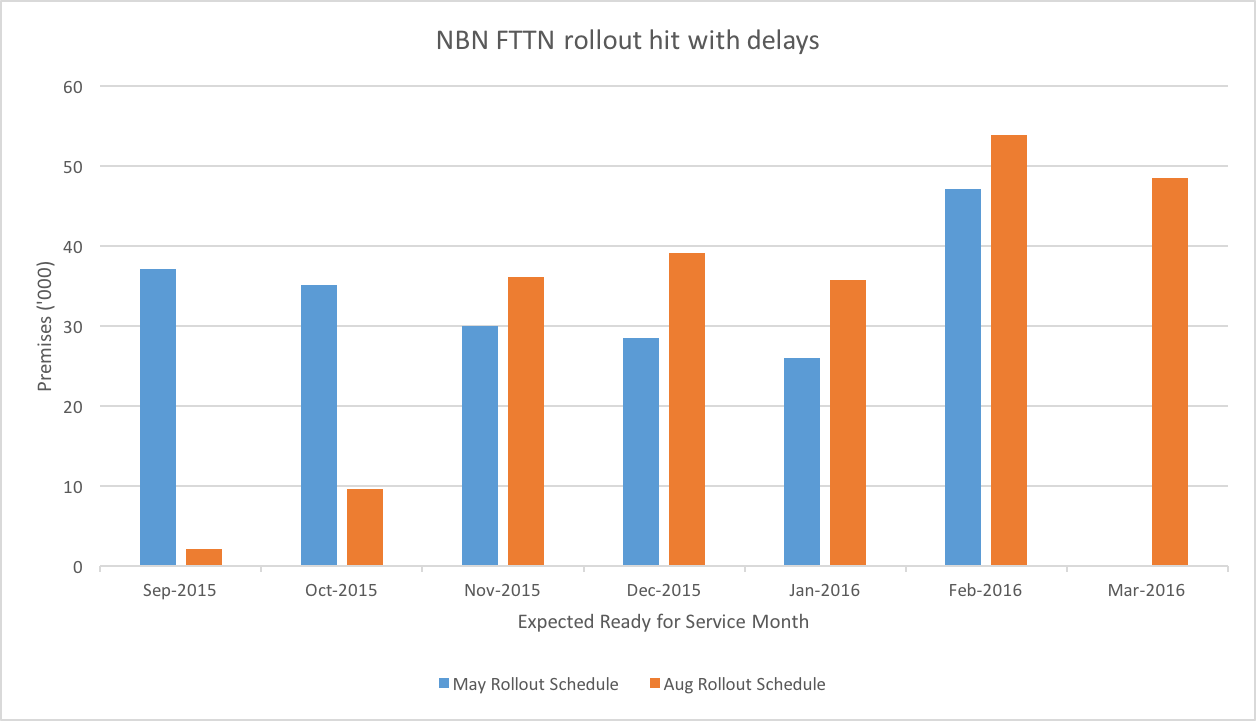
Analysis of nbn’s monthly rollout schedule has revealed that the ambitious Fibre to the Node switch-on has been delayed for hundreds of thousands of premises by up to four months.
According to rollout information produced by the company rolling out the National Broadband Network, the ready for service dates for around 164 thousand premises in the NBN Fibre to the Node trial area have been delayed since the company’s estimates in May.
In May, the company estimated that 37,200 FTTN premises will be declared “Ready for Service” in September 2015 with another 35,200 premises added in October. However, the latest monthly ready for service plan released by the company last week shows a mere 2,100 premises will be declared “Ready for Service” in September. Delays continue into October, with only 9,600 premises expected to be activated in that month.
In total around 164 thousand premises have been pushed back by up to 4 months.
A full list of areas delayed can be found at the bottom of the post.
Graph: NBN’s FTTN Expected Ready For Service dates are slipping. (Blue bars show estimates in May, orange bars show estimates in August.)
The raw data:
Table showing the change in the number of FTTN premises expected to be declared “Ready for Service” by nbn from May to August:
RFS Month
May Rollout Schedule
(‘000)
Aug Rollout Schedule
(‘000)
Net change
(‘000)
Sep 2015
37.2
2.1
-35.1
Oct 2015
35.2
9.6
-25.6
Nov 2015
30
36.1
6.1
Dec 2015
28.5
39.2
10.7
Jan 2016
26
35.8
9.8
Feb 2016
47.2
53.9
6.7
Mar 2016
0.0
48.5
48.5
Table showing the full list of Service Area Modules (SAMs) where nbn has delayed the Ready for Service dates:
The devil is in the detail – July’s quarterly construction plan shows 83k premises removed from the nbn rollout plan.
Analysis of the 18 month rollout plan released in July by nbn has shown that around 83,500 premises previously listed as being in the 18 month plan had been removed.
The areas removed were slated for a Fibre to the Node rollout to commence during 2016 and include the areas of and surrounding:
New South Wales
Cessnock/Bellbird
Darlington Point
Queensland
Brassall
Currumbin
Helidon
Magnetic Island
Samford
Gold Coast/Tweed Heads
Mount Crosby
Sunshine Coast/Noosa
Pittsworth
Robina
South Australia
Flinders
Tasmania
Queenstown
Rosebery
Zeehan
(for more information, see full table at the end of the post)
At the start of July, the company responsible for building the National Broadband Network announced in a media release that an additional 200,000 premises were added to the nbn rollout.
From initial calculations, this figure was derived from the total number of premises that were added to the rollout plan and does not take into account the number of premises removed from the plan.
If true, this means that the net increase in number of premises expected to commence construction within 18 months would be around 40% less than announced (from 200,000 to around 120,000 premises) in the July press release.
Today, nbn™ updated their rollout map to include new areas where build preparation commenced last month. As predicted on jxeeno blog last month, this month marks a milestone in the company’s implementation of the Multi-Technology Mix rollout methodology with all 152 of the new Serving Area Modules added set to MTM.
None of the areas added this month will use purely Fibre to the Premises – however, it is expected parts of some Serving Area Modules may use FTTP where economically feasible as part of the company’s established MTM deployment principles. The majority of premises in the listed areas are expected to get a Fibre to the Node or Fibre to the Basement connection. A further breakdown of technology-by-area or premises is not available on the company’s public website.
nbn™ has clarified some of the contents of the original post. The post has been updated in light of this new information.
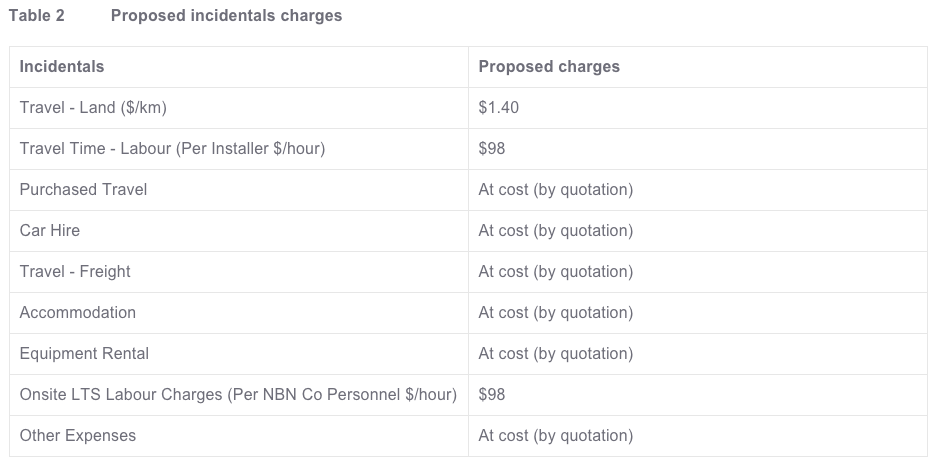
As part of nbn™’s industry consultation on the Long Term Satellite Service launching next year, the company released a list of proposed charges for the satellite service to Access Seekers (service providers) for feedback last Friday. A summary table was released to the public this morning.
The table lists a number of new proposed charges, including a reactivation fee, installation, installer travel costs and a range of late or missed appointment fees.
Table 2: showing some proposed charges for the NBN Long Term Satellite
Under the proposed charges, the company will charge the customer through the internet service provider an installation fee based on the distance the installer has to travel (charged at $1.40/km) and also pay an hourly rate for the time they spent driving and installing the equipment (at $98/hour). This is in contrast with nbn™’s current cost structure for the Fixed Wireless and Fixed-Line products where the installation is free for the customer.
Following a map update yesterday, NBN Co has removed approximately 58 thousand premises that were previously slated for a Fibre to the Premises rollout from its rollout map.
These premises, spread across 22 Serving Area Modules (SAMs) in NSW, VIC, QLD, SA and WA, were all in the Build Preparation phase where Telstra’s pit and pipe remediation works commences and detailed designs of the SAM being finalised with NBN Co’s construction partners.
The majority of these SAMs are covered by Telstra’s or Optus’ HFC networks, which NBN Co is expected to acquire, upgrade and integrate into the National Broadband Network as part of their so-called “Multi-Technology Mix” rollout strategy. It is expected that most of these areas will now be delayed until the HFC deals are finalised and rollout commences.
However, there are also some areas such as Dubbo (2DBB-06) that are not covered by the HFC networks but were still removed from the map.
Update 15/04/15: According to Daily Liberal, 2DBB-06 was delayed due to an “over ambitious” rollout sequencing by NBN Co.
A full list of SAMs removed, their coverage localities and the approximate number of premises covered by each SAM can be found below. Dave Cooper has also collated and compared the maps of the areas removed. He has tweeted GIFs of the before and after SAMs removed. They can be found below the opinion piece 🙂
SAM ID
Localities
Approx. # of Premises
2BLK-08
Doonside
2,700
2DBB-06
Dubbo
2,400
2CAM-03
Campsie
2,700
2CAM-04
Campsie, Belfield
2,800
2HOM-05
Strathfield South, Belfield
2,800
2HOM-06
Greenacre
2,600
2LIV-06
Warwick Farm
2,600
2LIV-09
Moorebank
2,600
3FSR-02
West Footscray, Footscray
2,400
3FSR-11
Footscray
2,400
3KEY-06
Keysborough
2,600
3WER-04
Wyndham Vale
2,400
4AAR-04
Sunnybank Hills, Runcorn
2,800
4AAR-05
Karawatha, Runcorn, Stretton, Calamvale
2,800
4APL-05
Carseldine, Bridgeman Downs
2,400
4BDB-04
New Chum, Redbank, Collingwood Park
1,900
4NDG-04
Nundah, Northgate
3,700
4NDG-05
Wavell Heights, Nundah
2,900
4NDG-06
Virginia, Wavell Heights, Northgate
2,900
5MOD-08
Redwood Park, Modbury Heights
2,300
6APP-05
Winthrop
2,600
6SPT-05
Como
2,700
Total
58,000
Opinion: the good, and the bad
(opinion) It’s not the first time that NBN Co has removed areas from the rollout map, and it won’t be the last. But it’s another significant reduction of premises covered by the Fibre network.
The good news is that NBN Co is deciding to make better use of tax payers money in achieving its expectations (as outlined in the Statement of Expectations, which only requires min. 25 mbps, remember!). Once DOCSIS 3.1 is rolled out, the HFC network upgrade will be vastly better than current HFC services and indeed — should be able to deliver speeds comparable to the current FTTP network.
The sad news is that you won’t get fibre (but it’s okay!) and you probably won’t get faster internet for some time yet… at least until the HFC deal is finalised and the upgrades are done.
It is disappointing to see NBN Co add these areas, knowing the HFC deal was ahead, then backtrack and remove these areas silently. No doubt, there will be many disappointed people around Australia that their beloved fibre connections will no longer come to them.
I believe that, as hard as it may be, NBN Co has a role in informing these communities that they were removed from the map for a reason and not to fear. To have them on as “build preparation has commenced”, then suddenly remove them because of a change in policy that was known months in advanced will only cause confusion and angst in the community.