A smattering of thoughts on the new bundled CVC pricing

I’m a bit busy at the moment, but I thought I’d put together a few of my initial thoughts and questions on the new CVC pricing.

Thanks to a handy-dandy embargo, there are already a plethora of articles around detailing NBN Co’s new (proposed) pricing construct this morning… so, I won’t bore you with the exact details of the changes.

But if you’re not already up to speed, naturally I’d recommend a read of Angus Kidman’s article on the changes on finder.com.au… but this time, it’s also because it includes an analogy to pots and stovetops.

If that doesn’t float your saucepan, other articles are just a quick search away.

Back of napkin calculations

nbn™ 50

The new nbn™ 50 AVC with 2 Mbps of bundled CVC comes in at $45 ex GST vs $34 ex GST currently but with only 50 kbps CVC bundled1.

So the cost difference of $11 ($45 – $34 = $11) is what an RSP would have spent on CVC under the current model. Assuming the industry average charge of $14.25 per Mbps2, the $11 left over would allow them to purchase 0.77 Mbps ($11 / $14.25 per Mbps = 0.77 Mbps).

Since the new nbn™ 50 comes with 2 Mbps, this represents a 1.6x increase in CVC allocation per user for the same price. Not bad.

nbn™ 100

On the other hand, the new nbn™ 100 looks nowhere near as generous.

The new nbn™ 100 AVC with 2.5 Mbps of bundled CVC comes in at $65 ex GST vs $38 ex GST with the 50 kbps CVC credit bundled1.

Doing the same calculations as before, this leaves $27 for CVC under the current model. This is equivalent to ~1.89 Mbps of CVC using the industry average rate1, or a 0.3x increase in CVC allocation per user for the same price currently. That’s tiny.

Given this, I wouldn’t expect the take-up of the new nbn™ 100 product to be huge. The new construct effectively forces RSPs to buy at least 2.5 Mbps of CVC per user all year, all around… which could be a problem.

This constraint will likely deter providers (especially those in the low-cost market) from selling a 100/40 product since: a) CVC-equivalent cost per user is likely above the current annual CVC average cost per user on a 100/40 retail offering, and; b) it gives RSPs no flexibility to reduce CVC in the low-demand season.

Remember, bandwidth requirements can fluctuate seasonally — usually peaking during school holidays.

If NBN Co were to retire the current separated AVC/CVC product set completely (which, by the way, it has NOT said it would do), I’d be surprised to see any 100/40 Mbps plan priced under $110 retail.

More questions

The articles about the pricing changes so far are light on details. So, naturally, I have a few questions about the mechanics of the new products:

CVC mixing for bundled and unbundled products?

An interesting question is whether NBN Co will allow mixing existing unbundled and new bundled products in the future. I doubt they would — otherwise, providers will just buy a bunch of new nbn™ 50 products and allow other customers on the non-bundled AVCs to free-load off the bundled CVC.

How will Dimension-based CVC discount be calculated?

On the front of the Dimension-based CVC discount: if NBN Co allows both bundled and unbundled products to co-exist, will the average CVC allocation per user be calculated across both bundled and unbundled products?

If they don’t, RSPs may no longer be able to afford to offer services to low usage users. These users might cost RSP too much to bump up to the new product set, but since the average CVC per user in the unbundled segment has plummeted, it may cost them too much to leave on the unbundled segment as well.

But if they do, the unbundled products could end up hurting NBN Co’s bottom line more as NBN Co will likely have to pay out more of the dimension-based CVC Discount to RSPs who adopt the new bundled products but also retain a good smattering of unbundled products.

A word on industry average CVC

Note that I am using the industry average1 CVC pricing here as the benchmark.

Even if an RSP allocates more CVC per user on higher speed tiered AVC, the current dimension based CVC discount is calculated on the average CVC allocation per user across all CVCs — making the average a realistic comparison benchmark for most RSPs unless they skew significantly from average.

If they currently allocate more CVC per user than the industry average, the apparent savings under the new structure would be smaller because of the current Dimension-Based Discount.

Conversely, if they allocate less CVC per user than the industry average, the apparent savings under the new structure would be greater.

1 Currently, each AVC comes with a 50 kbps CVC credit. Since it’s such a small amount, we might as well disregard for the purpose of this discussion.
2 Industry average based on ACCC NBN Wholesale Market Report. Average CVC per user is 1.09 Mbps, falling within the 1000 to 1149 kbps bracket in NBN Co’s dimension based CVC discount. This is equivalent to $14.25 per Mbps of TC-4 CVC ex GST.

Sydney bus contract 6 to be privatised – which routes will be affected?

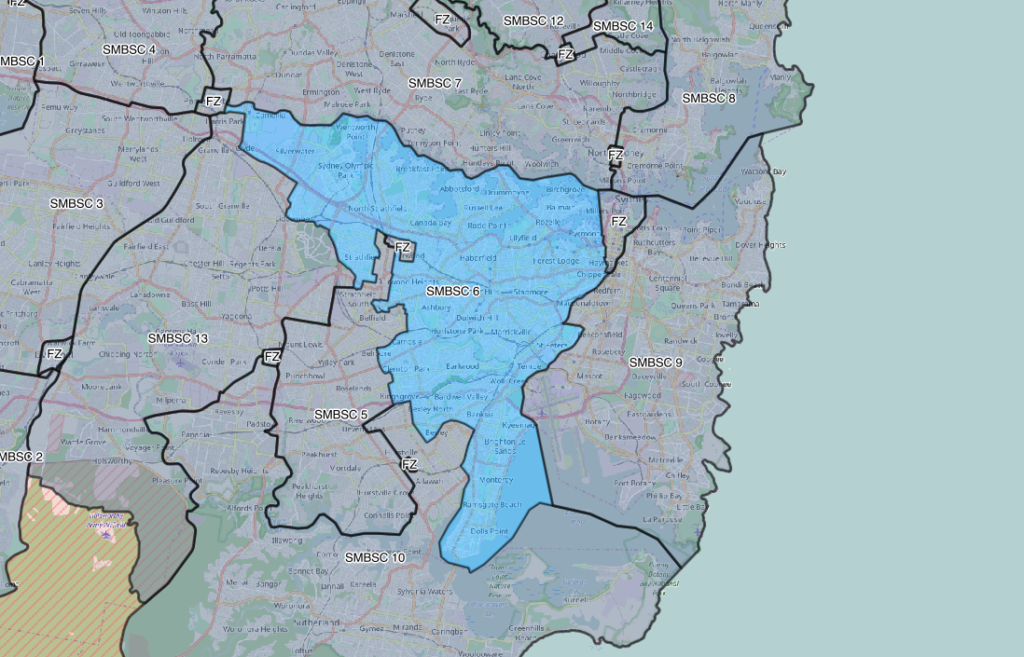
The state government has announced the intention to privatise the operation of bus services in the Sydney Metropolitan Bus Service Contract Region 6 (SMBSC 6).

Government operator State Transit Authority (STA) currently holds contracts 6 – 9, which geographically covers the Inner West, Eastern Suburbs, North Shore and Northern Suburbs. Contract 6 predominantly covers Inner West services, with some services reaching into the Eastern Suburbs, up to the Northern Suburbs and down south to the St George area.

Map showing Sydney Metropolitan Bus Service Contract Region 6

Notwithstanding changes route which may occur between now and privatisation, 223 bus routes will be affected including 59 regular bus routes and 164 school bus routes:

Regular bus routes

Route Name Route Description
401 Lidcombe to Sydney Olympic Park
406 Five Dock to Hurlstone Park
407 Burwood to Strathfield
408 Rookwood Cemetery to Burwood via Flemington
412 Campsie to City Martin Place via Earlwood
413 Campsie to City Martin Place via Canterbury
415 Campsie to Chiswick
418 Bondi Junction to Burwood
422 Kogarah to City Martin Place
423 Kingsgrove to City Martin Place
425 Tempe to Dulwich Hill
426 Dulwich Hill to City Martin Place
428 Canterbury to City Martin Place
430 Kogarah Shuttle
431 Glebe Point to City Martin Place
433 Balmain to Central Pitt St
436 Chiswick to Central Pitt St
437 Chiswick Wharf to Abbotsford Wharf Shuttle
438 Abbotsford to City Martin Place
439 Mortlake to City Martin Place
440 Bronte to Rozelle
441 Birchgrove to City Art Gallery via QVB
442 Balmain East Wharf to City QVB
444 Balmain East Wharf to Campsie
445 Balmain East Wharf to Campsie via Lilyfield LR
460 Five Dock to Concord Hospital via Canada Bay
461 Burwood to City Domain
462 Mortlake to Ashfield
463 Bayview Park to Burwood
464 Ashfield to Mortlake
466 Ashfield to Cabarita Park
470 Lilyfield to City Martin Place
473 Rockdale to Campsie
476 Rockdale to Dolls Point (Loop Service)
477 Miranda to Rockdale
478 Miranda to Rockdale via Ramsgate
479 Rockdale to Kyeemagh (Loop Service)
480 Strathfield to Central Pitt St
483 Strathfield to Central Pitt St via Australian Catholic University Strathfield
487 Bankstown Central to Canterbury
490 Drummoyne to Hurstville
491 Hurstville to Five Dock
492 Drummoyne to Rockdale
493 Roselands to Rockdale
495 Kingsgrove to Bexley North
502 Five Dock to City Town Hall
504 Chiswick to City Domain
508 Drummoyne to City Town Hall
526 Burwood to Rhodes Shopping Centre
L23 PrePay Only – Kingsgrove to City Martin Place (Limited Stops)
L28 PrePay Only – Canterbury to City Martin Place (Limited Stops)
L37 Haberfield to City Town Hall (Limited Stops)
L38 PrePay Only – Abbotsford to City Martin Place (Limited Stops)
L39 PrePay Only – Mortlake to City Martin Place (Limited Stops)
M20 Prepay Only – Botany to Gore Hill
M30 Prepay Only – Sydenham to Mosman
M41 Hurstville to Macquarie Park
X04 PrePay Only – City Domain to Chiswick (Express)
X25 Sydney Olympic Park to Strathfield


School bus routes

Route Name Route Description
560s Ashfield Station to Trinity Grammar Summer Hill
561s Balmain to Newington College
562s Trinity Grammar Summer Hill to Ashfield Station
563s Summer Hill Station to Trinity Grammar Summer Hill
565s Kingsgrove Station to Trinity Grammar Summer Hill
566s Trinity Grammar Summer Hill to Kingsgrove Station
567s Rockdale Stn to Moorefield Girls High
568s Strathfield Station to Rosebank College
569s Rosebank College to Pemberton & Arthur Sts Strathfield
570s Rosebank College to Five Dock Shops
571s Rosebank College to Five Dock Shops
572s Rosebank College Five Dock to Croydon Park
573s Rosebank College to Concord Hospital
574s Rosebank College to Homebush Station
575s Homebush Station to Rosebank College
576s Rosebank College to Canterbury Station
577s Rodd Point to St. Patricks Strathfield
578s St. Patricks Strathfield to Five Dock Shops
579s Strathfield Stn to St. Patricks Strathfield
580s St Patricks Strathfield to Punchbowl Rd, Belfield
581s St. Patricks Strathfield to Belmore Station
582s Drummoyne to St. Patricks Strathfield
583s St. Patricks Strathfield to Five Dock Shops
584s St. Patricks Strathfield to Rhodes Station
585s St. Patricks Strathfield to Burwood & Parramatta Rds
586s St. Patricks Strathfield to Burwood & Parramatta Rds
587s St. Patricks Strathfield to Burwood Stn
588s Burwood to St. Patricks Strathfield
589s St. Patricks Strathfield to Ashfield Station
590s De La Salle Ashfield to Hurlstone Park Station
591s De La Salle Ashfield to Rodd Point
592s Bethlehem College to Strathfield Stn
593s Haberfield to Homebush Public School
595s Parramatta Rd & Dalhousie Sts to Burwood Girls High
596s Burwood Girls High to Leichhardt Town Hall
597s Burwood Girls High to Georges River Rd & Burwood Rd
598s Earlwood to Hunters Hill High
600s Strathfield Girls High to Strathfield Stn
601s Strathfield Girls High to Concord Hospital
602s Strathfield Girls High to Ashfield Station
603s Strathfield Girls High to David St & Liverpool Rd, Burwood
604s Burwood Stn to Strathfield Girls High
605s Strathfield Girls High to Burwood Rd & Gipps St,Concord
606s Earlwood to Christian Bros Lewisham
607s Kingsgrove Depot to Christian Bros Lewisham
608s Christian Bros Lewisham to Undercliffe (Cooks River Bridge)
609s Campsie Station to Christian Bros Lewisham
610s Christian Bros Lewisham to Kingsgrove Station
611s Belfield (Punchbowl Rd) to Christian Bros Lewisham
612s Christian Bros Lewisham to Belfield (Punchbowl Rd)
613s Georges River & Burwood Rds to Christian Bros Lewisham
614s Five Dock Shops to Christian Bros Lewisham
615s Concord Shops to Christian Bros Lewisham
616s Concord Shops to Christian Bros Lewisham
617s Campsie Station to Christian Bros Lewisham
618s Campsie Station to Christian Bros Lewisham
619s Christian Bros Lewisham to Campsie Station
620s Christian Bros Lewisham to Earlwood
621s St.Maroun School to Bexley Rd & William St (Kingsgrove)
622s Kingsgrove North High to Belmore Station
623s Kingsgrove North HS to Earlwood
624s Campsie Station to Kingsgrove Depot
625s Clarke St, Earlwood to Belmore Station
626s Santa Sabina Strathfield to Drummoyne
627s Santa Sabina Strathfield to Five Dock Shops
628s Bexley Rd & William St to Canterbury Boys High
629s Canterbury Girls High to Earlwood
630s Canterbury Girls High to Belmore Station
631s Canterbury Boys High to Belmore Station
632s Campsie Station to Canterbury Boys High
633s Dulwich Hill Shops to Canterbury Primary
634s Canterbury Primary to Dulwich Hill Shops
635s St. Marthas Strathfield to Drummoyne
636s Bexley Rd & William St, Kingsgrove to Kingsgrove High
637s Bexley Post Office to Kingsgrove High
638s Canterbury Rd & Tincombe St, Canterbury to Kingsgrove High
639s Greenhills St & Liverpool Rd, Croydon to Kingsgrove High
640s Kingsgrove Primary to Campsie Station
641s Kingsgrove High to Rockdale Stn
642s Georges River Rd & Brighton Ave to Kingsgrove High
643s Canterbury Rd & Beamish St, Campsie to Kingsgrove High
644s Marrickville High to Kingsgrove Depot
645s Kingsgrove to St. Scholasticas, Glebe
646s Canterbury to St Scholastics
647s Railway Square to St. Scholasticas, Glebe
648s St. Scholasticas, Glebe to Balmain (Gladstone Pk)
650s St. Scholasticas, Glebe to Parramatta Rd & Dalhousie Sts
651s City to Balmain High
652s Balmain High to City
654s Canterbury Station to Balmain High
655s Dalhousie & Deakin to Concord High School
656s Concord High School to Five Dock Shops
657s Concord High School to Chiswick
658s Annandale to Concord High School
659s Drummoyne to Concord High School
660s Concord High School to Burwood, Westfield
661s Burwood Stn to Concord High School
662s Concord High School to Mortlake
663s Concord High School to Drummoyne
664s Parramatta Rd, Petersham to Rosebank College
670s Domremy College Five Dock to Leichhardt Town Hall
671s Earlwood to Domremy College, Five Dock
672s Domremy College. Five Dock to Campsie Station
673s Domremy College to Burwood
674s Concord Road & Victoria Street to Domremy College
675s Domremy College to Burwood & Canterbury Rds
676s Burwood & Canterbury Rds to Domremy College, Five Dock
677s Domremy College to Concord Shops
678s Domremy College to Campsie Station
679s Kingsgrove Depot to Domremy College
680s Balmain (Gladstone Pk) to Fort Street High
681s Fort Street High to Strathfield Stn
682s Fort Street High to Balmain (Gladstone Pk)
683s Blackwattle Bay Campus (Glebe High) to Canterbury Station
684s Blackwattle Bay Campus (Glebe High) to Newtown Bridge
685s Blackwattle Bay Campus (Glebe High) to Millers Point
690s Blackwattle City Campus – Balmain
691s Blackwattle City Campus – Leichhardt Market
692s Blackwattle Bay Campus (Glebe High) to City
693s City to Blackwattle Bay Campus (Glebe High)
700s Earlwood to Tempe High
701s St. Pius, Enmore to Tempe
702s Rockdale Stn to St. Pius, Enmore
710s Homebush Boys High to Cabarita Junction
711s Homebush Boys High to Concord Hospital
712s Homebush Public School to Strathfield Stn
713s Broughton St & Parramatta Rd,Burwood to Homebush Boys High
714s Strathfield Stn to Homebush Public School
715s St. Marys Concord to Homebush Station
718s Ashfield Boys High School to Broadway, Enfield
720s St. George Girls High to Campsie Station
721s Campsie Station to St. George Girls High
725s De La Salle Ashfield to Liverpool Rd, Strathfield
726s De La Salle Ashfield to Earlwood
730s Endeavour High to Rockdale Stn
731s Rockdale Stn to Miranda Station
732s Rockdale Stn to Brighton Public School
733s Kogarah Station to Endeavour High
734s Endeavour High to Ramsgate & Rocky Pt Rds, Ramsgate
735s St. Ursulas Kingsgrove to Kingsgrove Depot
736s St. Ursulas Kingsgrove to Croydon Park
738s Campsie Public School to Claremont & Orissa Sts Campsie
740s John St, Pyrmont to Ultimo Primary
741s P.L.C. Croydon to Drummoyne
743s Earlwood to Burwood Girls High
745s Drummoyne to Drummoyne Primary
750s Ramsgate to Miranda
751s Taren Point to Rockdale Stn
753s Bankstown Hospital to Kingsgrove & Canterbury Rds, Belmore
755s Belmore Station to Kingsgrove Station
757s Drummoyne to Burwood Stn
760s Newington to Concord High
761s Newington to Concord High
762s St. Scholasticas, Glebe to Forest Lodge Public School
763s St. Finbars School to Ramsgate
764s Dolls Point to Marist Bros, Kogarah
765s Canterbury to Marist Bros, Kogarah
766s Rockdale Stn to Moorefield Girls High
767s Moorefield Girls High to Rockdale Stn
768s Rockdale Stn to Endeavour High
769s Bay St & Moate Av, Brighton to Moorefield Girls High
770s Archery Centre, Wentworth Point to Concord High School
780s Burwood Stn to Homebush Boys High
781s Georges River Rd & Walsh Ave to Homebush Boys High

Don’t stress: bus timetables aren’t being “scrapped”

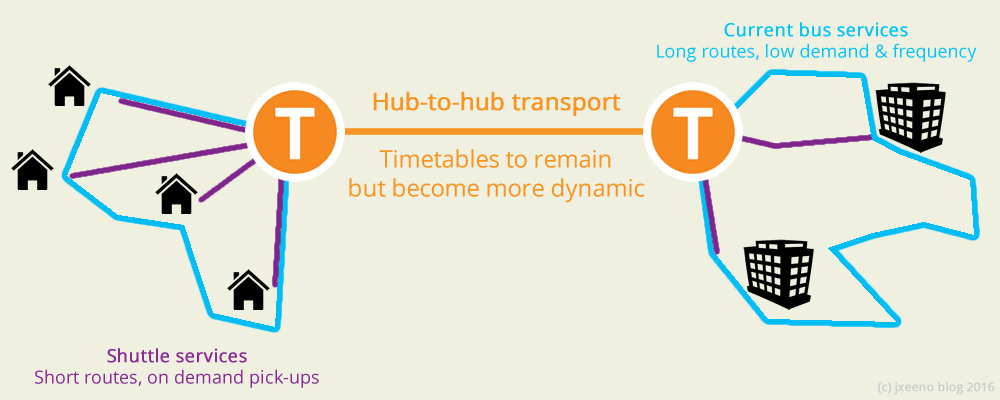
Timetables are set to become more dynamic with on-demand complementary shuttle services

Yesterday, the Minister for Transport announced that Transport for NSW will trial “on-demand” public transport next year as part of their Future Transport Roadmap. A number of media outlets reported “New South Wales Government to scrap bus timetables” based on initiatives promised to “transform the mass transit network”.

As one would expect, a flurry of fury followed after the announcement. Punters complained of the inability for current buses to stay within their current timetables as it is. How are they to deliver services quality “without a timetable”?

I don’t think the media did a great job at explaining what the plans were. So, let’s break it down. There are two parts to this puzzle:

  1. Timetables are becoming more dynamic
  2. On-demand services are being introduced

The truth is, timetables aren’t going way but are becoming more flexible. There are also additional on-demand services to help make the trip to timetabled services more efficient.

Hub and spoke model

You may have heard of the hub-and-spoke model. That’s where commuters take a short service close to their homes to a major transport hub to reach their final destination.

This reduces the number of low demand, point-to-point services required to get commuters to and from their destinations whilst still maintaining flexible route options.

The challenge with the current system is that spoke services (the short hops between homes and hubs) have long routes within the suburbs to get to as many pick up points as possible. This means that it could take a long time for commuters to get from their home to the hub regardless of whether all the pick up points have passengers.

On-demand spoke services

The on-demand trial that was being mentioned is about improving commuter connections to and from transport hubs. As the Future Transport Roadmap says:

The future of personalised transport will involve customers being able to book flexible, on-demand local services to make first- and last-mile connections to and from mass transit hubs.

Page 41, Future Transport Technology Roadmap 2016

On-demand services would complement existing “spoke” bus routes with routes being optimised for booked demand.

Diagram showing how a hub and spoke model with on-demand services could work

On-demand example:

Imagine the resident living in the middle of the suburbs, around a 15 minute drive from the train station. Currently, the options may be for the resident to drive their car to the station and commute to work. However, parking spots are limited.

Catching a bus is also an option. However, the closest bus stop may be a 10 minute walk away and only runs during peak hours. Worse still, it’s a bus service which is route is long and stops at many locations within the suburb before reaching the train station.

The on-demand public transport model tries to solve this. A commuter can “book” what is effectively a shuttle service between their home and the closest train station in advance. The route and times for this on-demand service will be generated continuously based on who’s booked a service.

Dynamic timetabling in trunk routes

It’s something that Sydney Trains have been doing for years. Despite having seemingly static timetables, Sydney Trains timetables are generated at least once a day to account for things like track work, special events and “operational issues”.

Some bus routes are also brought in especially in time for special events. For example, an example I know well is the Central to Moore Park shuttle during major sporting events.

The promise made in the Future Transport roadmap is that these dynamic timetables will reach more modes of transport (including buses). These timetables will also extend in reach, modelling patterns based on weather, demands based on day of week.

Using the supply/demand insights, develop an algorithm that optimises the timetable for day-of-week, weather and planned/unplanned events

Page 88, Future Transport Technology Roadmap 2016

It’s also about being able to generate new routes and increased frequency when new demands arise. With the Opal data that Transport for NSW has on their hands, they could potentially generate new high demand, point-to-point routes to cater for new businesses opening up or when new developments are built.

Conclusion

Don’t stress: timetables aren’t going away. They remain very important for the operation of transport services.

The good news is that the timetables will likely be adjusted more frequently based on demand on each route at particular times.

On-demand services will likely complement existing spoke services to make them more efficient and convenient for commuters.

Hopefully, this will less crowded services and quicker journey times into the future.

2016 Senate Election tibits

Every election, the AEC releases what are effectively digitised versions of every single “formal” Senate ballot paper in the election.  This year, NSW’s dataset is a 1.06GB CSV file.

Since the Senate voting rules have changed, I thought I’d have a bit of fun and take a look at how well Australians (specifically NSW voters) followed these new rules.

‘Below the line’ vs. ‘Above the line’ voting

First off, let’s look at below the line vs above the line voting.  The new rules suggest voters place at least 12 boxes below the line or 6 boxes above the line.  I use the word “suggest” because incomplete votes are still “saved” under new savings provisions which came with the changed rules.

Let’s take a look at the NSW breakdown of formal Senate votes:

  • Below the line*: 185,387
  • Above the line*: 4,234,502
  • Unspecified**: 72,310

* For the purpose of this summary, ballots considered ‘below the line’ if they do not contain numbers marked ‘above the line’.  Ballots considered ‘above the line’ are the inverse. ** Unspecified ballots are ballots saved by various ‘savings provisions’ and are still considered formal votes.  For example, these could include ballots where the voter placed ‘1’ above the line and 2-6 below the line.

Voting below the line

The new voting rules made it easier for voters to vote “below the line”.  Not only did voters not have to fill in every single box on the paper, the savings provisions are more generous than ever making more incorrectly filled ballots considered “formal”.

The missing ‘1’: Right off the rank, there is a data anomaly from these generous savings provisions.  There were more below the line voters which had placed a ‘2’ in their ballot paper then voters who had placed a ‘1’ below the line.  Around 2,054 “below the line” ballots neglected the ‘1’ compared to 608 voters who neglected the ‘2’.

Voting only ‘6’ below the line: Many voters also got confused with the 6 “above the line” or 12 “below the line”.  Around 2.5% of NSW below the line ballots were only filled to the number ‘6’, rather than the ’12’ which was prescribed by the AEC^.

Overall compliance: Having said all of that, 96.7% of NSW “below the line” voters followed the instructions correctly and placed a number ’12’ below the line.

Beyond 12 below the line: However, the subsequent drop-off was huge.  Only 48,505 ballots had the number ’13’ below the line, compared with 179,196 for the number ’12’.

It was reported that many voters were advised to 12 numbers below the line, and 12 only, which could have played a role in the substantial drop-off.  However, it could also be the case that the majority of voters only want to do the “bare minimum” in terms of filling out a ballot.

Only about 26% (48,505) of below the line voters placed a ’13’ below the line. 4,332 ballots (2.34% of below the line ballots) had all 151 boxes filled in.

^ N.B. I am using the number of voters who placed a ‘6’ minus the number of voters who placed a ‘7’ anywhere below the line as a proxy for the total number of votes below the line. Further analysis is required to determine the exact number of voters who placed exactly 6 numbers below the line.
 

Voting above the line

Only 1 above the line: Despite a vocal campaign from the AEC to make voters aware of the changed Senate voting rules, around 6% of above the line voters continued to simply place a single ‘1’ above the line^. This was the previous above the line voting method.

Beyond 6 above the line: As with the below the line vote, there was a substantial drop off beyond the minimum number of boxes prescribed to be filled. 3,766,149 (3.8 million) voters placed a ‘6’ above the line compared with a mere 224,416 ballots with a ‘7’.

Compliance (BTL vs ATL): Interestingly, above the line voters were not quite as acute in following the AEC instructions with only 89% of above the line voters managing to place a ‘6’ above the line (compared with 96.7% BTL voters complying with the 12 number ‘rule’).

^ N.B. Derived from the number of ballots with a ‘1’ above the line minus the number of ballots with a ‘2’ below the line. This is merely a proxy. Further analysis is required to determine the exact number of voters who placed exactly 1 number above the line. Excludes ballots with both below and above the line numbering (i.e. unspecified)

Thoughts…

Here are a few take outs:

  • Most voters continued to vote above the line
  • A substantial number of voters continued to only place ‘1’ above the line when voting, meaning their votes were immediately exhausted after their first nominated group or candidate
  • Most voters are doing the bare minimum when voting for the Senate (i.e. only filling in 6 ATL or 12 BTL).

If I had more time, I’d analyse the exact number of numbers per ballot (rather than the pseudo counting I have going on at the moment). I’d also convert ATL votes into BTL votes, which would then allow preference flow simulations to see exactly which votes ended up making the quota for the 12 NSW Senators we elected. But alas, too much data and too little time on my hands 🙂

Widespread delays plague Multi-Technology rollout

Analysis: Some areas delayed by up to 8 months, with 290k premises delayed by at least a month

The company responsible for building the National Broadband Network has updated its rollout schedule, revealing wide ranging delays of over a month in 105 multi-technology mix (MTM) rollout areas around Australia, affecting around 290,000 premises.

These rollout areas predominantly uses the Coalition’s preferred Fibre to the Node (FTTN) technology, where the company rolls out fibre to the neighbourhood and reconnects with the existing copper to the home.  Despite promising rollouts using the FTTN technology to be faster to complete, the company had reportedly been facing issues including slow rollout design approvals from power companies who will have to power the nodes in the streets.  The reasoning behind the latest set of delays is unknown.

The areas worst affected by the delay are Cygnet in Tasmania and Mornington in Victoria, with a delay of 8 months shifting completion dates from late 2016 to mid 2017.  The is followed closely by another rollout area in Mornington, Victoria as well as South Hobart and Margate in Tasmania and Garfield in Victoria with delays of between 6 and 7 months.

The rollout in Fletcher, NSW and suburbs near Claremont, Hobart, Tasmania have been set back by around 5 months.  Another 8 rollout areas, covering around 22,400 premises in parts of Victoria, Queensland, Western Australia, Tasmania and New South Wales have been delayed by 4 months.

For a full list of affected areas, refer to the table below.

Another 22 areas, not listed below, were delayed by less than a month.

Service Area Module (SAM) Locality May completion date June completion date # of months delayed Approx number of premises affected
7CYE-01 Cygnet Oct-2016 Jun-2017 8 600
3MOR-02 Mornington 12-Aug-2016 Apr-2017 8 3400
3MOR-05 Mornington Sep-2016 Apr-2017 7 2300
7HOB-12 South Hobart, Wellington Park, Fern Tree Oct-2016 Apr-2017 6 1000
7MGT-01 Electrona, Lower Snug, Margate, Snug, Coningham Dec-2016 Jun-2017 6 2000
3GAR-01 Garfield, Longwarry, Bunyip 05-Aug-2016 Feb-2017 6 2300
2NLT-01 Fletcher Oct-2016 Mar-2017 5 3700
7NWT-02 Chigwell, Berriedale Oct-2016 Mar-2017 5 2800
3TAG-04 Traralgon Oct-2016 Feb-2017 4 2600
4IGH-01 Ingham Oct-2016 Feb-2017 4 3000
6RKH-01 Safety Bay, Rockingham Sep-2016 Jan-2017 4 3100
6RKH-04 Rockingham, Safety Bay, Cooloongup Sep-2016 Jan-2017 4 3500
6ARM-02 Cardup, Byford Nov-2016 Mar-2017 4 4700
7BUI-04 Hillcrest, Montello, Park Grove, Parklands, Burnie Jan-2017 May-2017 4 1800
7HUL-01 Huonville, Ranelagh, Franklin Jan-2017 May-2017 4 2600
2GUL-01 Gulgong 15-Jul-2016 Nov-2016 4 1100
2NRN-01 Spring Farm Nov-2016 Feb-2017 3 800
7DER-04 Don, Stony Rise, Devonport Nov-2016 Feb-2017 3 3000
4SHF-02 Trinity Beach Sep-2016 Dec-2016 3 3200
2SHH-04 Flinders, Blackbutt Jan-2017 Apr-2017 3 3300
7ETD-01 East Devonport, Ambleside Dec-2016 Mar-2017 3 2600
7DSF-01 Dodges Ferry, Forcett, Lewisham, Primrose Sands, Carlton Dec-2016 Mar-2017 3 4300
7DER-03 Miandetta, Quoiba, Spreyton, Stony Rise, Tugrah, Aberdeen Jan-2017 Apr-2017 3 2900
3TAG-06 Traralgon 19-Aug-2016 Nov-2016 2 3400
2GLB-03 Run-o-Waters, Goulburn 22-Jul-2016 Oct-2016 2 2600
4WUR-09 Minyama, Buddina 08-Jul-2016 16-Sep-2016 2 3400
3MOE-03 Newborough, Moe 29-Jul-2016 Oct-2016 2 2800
2GLB-02 Goulburn 29-Jul-2016 Oct-2016 2 3200
3CRB-06 Craigieburn 29-Jul-2016 Oct-2016 2 4400
2GLB-04 Goulburn 22-Jul-2016 23-Sep-2016 2 2900
2ALB-01 South Albury, Albury 29-Jul-2016 30-Sep-2016 2 3600
7BUI-01 Emu Heights, Havenview, South Burnie, Wivenhoe, Burnie Dec-2016 Feb-2017 2 1200
3TAG-03 Traralgon East, Traralgon Sep-2016 Nov-2016 2 3100
4EDG-08 Kanimbla, Whitfield, Brinsmead Sep-2016 Nov-2016 2 2600
4FRV-01 Norman Gardens Sep-2016 Nov-2016 2 3300
7HOB-11 Moonah, New Town, Lenah Valley Sep-2016 Nov-2016 2 3000
3WBO-01 Warrnambool Sep-2016 Nov-2016 2 3700
7HOB-10 Sandy Bay Oct-2016 Dec-2016 2 3000
2BUP-03 Doyalson, Wyee, Blue Haven Nov-2016 Jan-2017 2 3100
2NRN-06 Harrington Park Nov-2016 Jan-2017 2 1800
3RYE-01 Rye Nov-2016 Jan-2017 2 4000
4BWE-01 Bowen Nov-2016 Jan-2017 2 2200
5MIC-01 Millicent Nov-2016 Jan-2017 2 2600
3CBR-64 Coburg North,Preston (Vic.),Reservoir (Vic.) Sep-2016 Nov-2016 2 1200
2BUP-01 San Remo, Buff Point 05-Aug-2016 Oct-2016 2 3200
3COL-02 Colac East, Elliminyt, Colac 05-Aug-2016 Oct-2016 2 3900
2MAI-09 Maitland, Telarah, Lorn 15-Jul-2016 09-Sep-2016 2 3300
3WAN-01 Wangaratta 15-Jul-2016 09-Sep-2016 2 3000
2MAI-06 Bolwarra Heights, Largs, Mindaribba, Bolwarra 22-Jul-2016 16-Sep-2016 2 2200
2ALB-04 North Albury, Albury 05-Aug-2016 30-Sep-2016 2 3400
2AVA-02 Avalon 05-Aug-2016 30-Sep-2016 2 2900
2MAI-01 Windella, Rutherford 12-Aug-2016 30-Sep-2016 2 1000
3MOE-04 Yallourn North, Newborough 19-Aug-2016 Oct-2016 1 3300
2MSV-03 East Bowral, Bowral 15-Jul-2016 26-Aug-2016 1 3500
2ALB-03 West Albury, Albury 29-Jul-2016 09-Sep-2016 1 3700
3SHP-09 Kialla West, Kialla 29-Jul-2016 09-Sep-2016 1 1500
2MTT-01 Mittagong, Willow Vale, Braemar 12-Aug-2016 23-Sep-2016 1 2000
4EDG-07 Earlville, Mooroobool, Bayview Heights 26-Aug-2016 Oct-2016 1 3400
3WAN-02 Wangaratta 15-Jul-2016 19-Aug-2016 1 2900
3WGU-04 Drouin East, Drouin 22-Jul-2016 26-Aug-2016 1 3400
7DER-01 Devonport 05-Aug-2016 09-Sep-2016 1 1800
2ERN-03 Green Point, Erina 12-Aug-2016 16-Sep-2016 1 3200
2KTB-02 Leura, Medlow Bath, Katoomba 12-Aug-2016 16-Sep-2016 1 3400
3WGU-05 Drouin 19-Aug-2016 23-Sep-2016 1 2800
4NEW-06 Cranley, Gowrie Junction, Torrington, Wilsonton, Wilsonton Heights, Cotswold Hills Dec-2016 Jan-2017 1 3300
2SHH-01 Shell Cove, Shellharbour, Dunmore Jan-2017 Feb-2017 1 3000
2NRN-05 Narellan, Narellan Vale, Elderslie Oct-2016 Nov-2016 1 2900
2PKE-05 Lake Heights, Berkeley Oct-2016 Nov-2016 1 3900
5GPC-05 Pooraka, Para Hills West Oct-2016 Nov-2016 1 3700
2PKE-02 Lake Heights, Warrawong, Cringila Oct-2016 Nov-2016 1 3700
3LOR-20 Lorne Oct-2016 Nov-2016 1 2500
3RMS-01 Romsey, Lancefield Oct-2016 Nov-2016 1 2700
3SUN-01 Sunbury Oct-2016 Nov-2016 1 3300
2NRN-03 Narellan Vale, Smeaton Grange, Harrington Park Oct-2016 Nov-2016 1 3800
4BDA-20 Babinda Oct-2016 Nov-2016 1 800
4FRV-03 Koongal, Lakes Creek, Nerimbera, Frenchville Oct-2016 Nov-2016 1 4300
4SAR-01 Sarina Oct-2016 Nov-2016 1 1900
6RKH-05 Waikiki, Cooloongup Oct-2016 Nov-2016 1 3700
6RKH-03 East Rockingham, Hillman, Rockingham, Cooloongup Dec-2016 Jan-2017 1 3300
6RKH-06 Waikiki, Safety Bay Dec-2016 Jan-2017 1 3500
6RKH-08 Rockingham, Peron Dec-2016 Jan-2017 1 3900
7CLT-01 Campbell Town Jan-2017 Feb-2017 1 700
5GPC-07 Mawson Lakes Jan-2017 Feb-2017 1 3600
3WDG-01 Wodonga, Leneva Sep-2016 Oct-2016 1 2700
3WAN-03 Wangaratta, Waldara Sep-2016 Oct-2016 1 1700
4NEW-09 Drayton, Harristown, Darling Heights Sep-2016 Oct-2016 1 3100
7EXE-01 Exeter, Gravelly Beach, Lanena, Rosevears, Swan Point, Blackwall Sep-2016 Oct-2016 1 900
4BUD-05 Palmwoods Sep-2016 Oct-2016 1 2100
4ROT-01 Rockhampton City, Depot Hill Sep-2016 Oct-2016 1 1400
4RED-01 Mount Cotton, Carbrook Sep-2016 Oct-2016 1 3000
4SHF-01 Trinity Beach, Trinity Park, Kewarra Beach Sep-2016 Oct-2016 1 1900
7NOL-01 Magra, New Norfolk, Lawitta Sep-2016 Oct-2016 1 2900
5BDT-20 Bordertown Nov-2016 Dec-2016 1 1600
7BIC-01 Bicheno Nov-2016 Dec-2016 1 900
5BRR-01 Berri Nov-2016 Dec-2016 1 2500
6ARM-01 Byford, Darling Downs, Haynes, Hilbert, Mount Richon, Wungong, Brookdale Nov-2016 Dec-2016 1 4000
6ARM-04 Forrestdale, Haynes, Seville Grove, Armadale Nov-2016 Dec-2016 1 3600
3MOE-01 Trafalgar, Moe 22-Jul-2016 19-Aug-2016 1 2700
6MDR-10 Erskine 27-May-2016 24-Jun-2016 1 2500
3PTO-05 Portarlington 15-Jul-2016 12-Aug-2016 1 2200
3PTO-06 St Leonards 15-Jul-2016 12-Aug-2016 1 2800
3OCG-02 Breamlea, Barwon Heads 22-Jul-2016 19-Aug-2016 1 2800
3SHP-10 Kialla 29-Jul-2016 26-Aug-2016 1 1300
7BUI-03 East Cam, Ocean Vista, Park Grove, Parklands, Shorewell Park, Cooee Feb-2017 Mar-2017 1 2900
7ETD-02 Latrobe Feb-2017 Mar-2017 1 2000

Analysis based on NBN Co’s rollout schedule, reproduced by Telstra on the Telstra Wholesale website.  A variety of sources were checked to confirm this information.

Opal CBD Increment: a quick follow up

A few people have written in about the CBD Increment since my blog post went live this morning. As it turns out, this CBD increment is “well documented”… in a 107 page handbook known as the Sydney Trains and NSW Trains Fares and Ticketing Customer Handbook.

I’ve tried looking all afternoon, and cannot find a link from either the Opal website nor on any portion of the Transport for NSW website discussing Opal or fares generally. It is, however, linked to from the Terms and Conditions page about paper tickets.

For those curious, the direct link can be found here. The part you’re looking for is page 74.

Quick summary

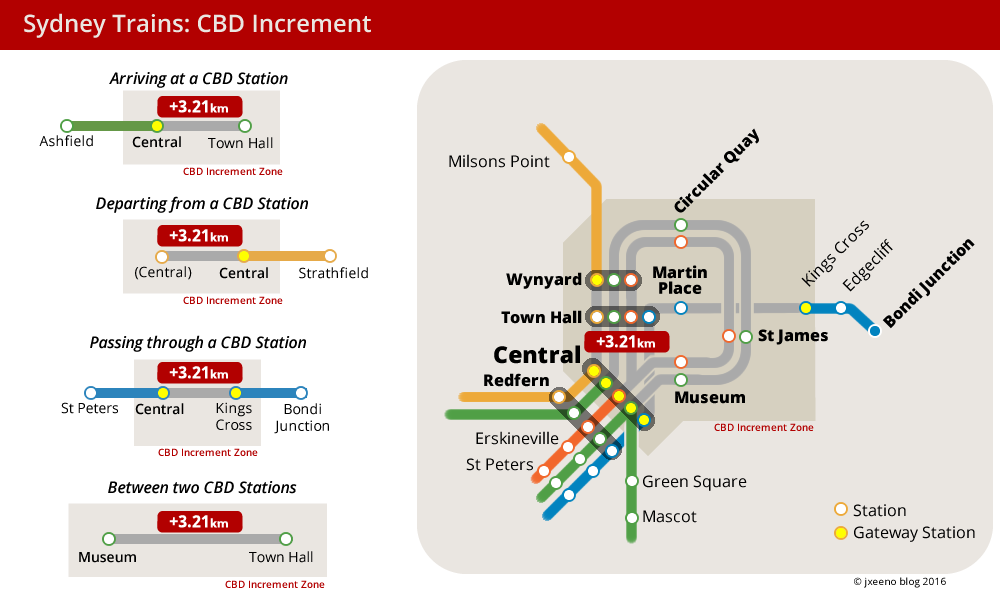
Basically, any train trip that traverses through or starts and ends at a CBD station (Central, Town Hall, Wynyard, Circular Quay, Martin Place, Kings Cross, St. James and Museum Stations) will incur an extra 3.21km distance in their trip.

There is one extra caveat though. Regardless of which of the CBD stations you get off at, TfNSW will calculate the end of your trip to a “Gateway Location” based on which line you came from… before adding the extra 3.21km. Let me elaborate:

CBD Gateway Station Table

Gateway Station Travelling via
Wynyard the Sydney Harbour Bridge
Central Redfern Station, or Airport Line
Kings Cross Eastern Suburbs Line

If you’re travelling from Macquarie University to any CBD Station, you will be charged the fare distance from Macquarie University to Wynyard (the Gateway Station for via Sydney Harbour Bridge) plus the extra 3.21km increment.

If you’re travelling from North Sydney to Newtown, you also have to add the increment.  You will be charged the distance fare from North Sydney to Wynyard (the Gateway Station for via Sydney Harbour Bridge) plus the extra 3.21km increment.  In addition, you will pay for Central (the Gateway Station for via Redfern Station) to Newtown.  Note, that the increment is only charged once.

CBDIncrement

The problem

The idea behind the CBD increment is so that periodical tickets (e.g. weekly tickets) can be sold as a “city ticket” meaning passengers can get off any any of the CBD stations with the same ticket.

However, this doesn’t make sense for the Opal system where fares are advertised on a distance basis. It’s misleading and disingenuous to advertise that Opal train fares are based on “track distance” when in fact, it’s based on a psudo-distance hidden away in a 170 page handbook.

A suitable analogy, in my opinion, is a grocer selling apples and oranges at $3.99/kg. However, hidden away in a 107 page handbook, the grocer says that oranges incur an extra 1 kg increment that can be found the aisle that sells milk. Surely, this is considered misleading advertising.

Like the grocer, Opal advertises different fares based on track distance bands with no reference to this psudo-distance calculation. Like the grocer, it hides the CBD increment in a lengthy handbook stored in a part of the website that doesn’t talk about Opal fares. Does this mean that CBD Opal fares constitute as misleading advertising?

While I personally don’t mind to pay extra for travelling through the busy CBD area, I think Transport for NSW needs to be transparent about it.  Fiddling with the distance travelled certainly doesn’t look great.

Just my two cents. Keen to hear people’s thoughts.

Opal secretly adds extra distance to CBD fares

This is why your train fares may be more than you think

Update: we now know how TfNSW calculates this increment… but there are still massive problems.

If you travel to and from a CBD station using an Opal card, Transport for New South Wales (TfNSW) may have been charging you a little extra every time you tap off.

It has been a relatively well kept secret until now, but the final IPART report into public transport fares revealed and recommended the removal of a hidden feature, known as the Opal ‘CBD Increment’. The report states that:

“the ‘CBD increment’ [adds an] extra notional distance to the distance travelled for rail trips that start or finish in the CBD”

Excerpt from IPART final report (Page 13)

I came across this issue after finding inconsistencies with distance calculations when building my Opal calculator, a easy-to-use tool to compare current Opal fares with those set to start in September. To my surprise, after exhaustive research, I’ve been unable to find any mention of this “CBD Increment” on the Opal or TfNSW website.

Even TfNSW doesn’t know this exists…

Reaching out to TfNSW to enquire about this, they seemed just as baffled as I was. After two phone calls, no one thus far has been able to explain to me what this CBD Increment is for, or how much extra distance is being added to each CBD trip. Although, they have promised to escalate my issue and come back to me with more information (this was two weeks ago).

What I know for sure is that this increment does exist. Having tested a few trips myself for research, it appears the distance increment is quite random.

Some affected trips

Here are a number of trips to the CBD which cost more than what you would expect if the fare was based solely on track distance:

CBD Destination From Station Track dist.
(km)
Expected Fare Actual Fare
Town Hall Ashfield 9.6 $3.38 $4.20
Summer Hill 8.3
Artarmon 9.2
Tempe 8.1
Wolli Creek 8.6
Arncliffe 9.8
Turella 9.9
Meadowbank 19.5 $4.20 $4.82
Auburn 19.9
Berala 19.6
Macquarie University 19.9
Macquarie Park 18.7
Turramurra 19.7
Riverwood 18.8
Museum Tempe 7.7 $3.38 $4.20
Arncliffe 9.4
Wynyard Tempe 8.9 $3.38 $4.20
Summer Hill 9.2

Note: these are a small selection of trips selected to test the CBD increment. It is not an exhaustive list of stations which are affected. Track distances are based on track information provided by TfNSW through its Open Data exchange.  Prices listed are Adult peak fares.
Some trips with track distance within the tolerances listed also appear to be unaffected by the CBD increment. I’m unable to to discern a pattern at this point in time.

A trip from Ashfield to Town Hall (a CBD station) has a total track distance of ~9.6 kilometres — just shy of the 10 kilometre fare band which will cost $3.38 for an Adult during peak time. However, when travelling on the train between these two stations, TfNSW charges for the higher 10–20km fare band, costing $4.20.

Will this stay?

Despite IPART’s recommendation, Transport for NSW has not indicated whether or not it will retain the CBD increment when the proposed fare changes come into force in September.

I’m still awaiting a response from TfNSW about my enquiry about this existence of this ‘CBD increment’. Let’s see what they say if and when they respond… I’ll update this post when that happens.

NBN technicians

Gigabit NBN: demand is there, but NBN pricing isn’t

It’s not that there’s no demand, it’s that NBN’s pricing model makes it impossible for providers to put any gigabit services to market.

There’s a common misconception that there is “no demand” for gigabit Internet services in Australia. After all, if there’s no actual customer taking up a gigabit service on the NBN — how can there possibly be any demand?

Apparently, despite providers around the world actively and successfully selling gigabit connections to speed-hungry residential customers, Australians are so “agile” and “innovative” that they see no need for higher speed connections that our counterparts in the rest of the developed world seek for.

At least that’s what the latest spiel from The Australian may lead you to think.

Of course, the paper is absolutely correct in saying that the only NBN customers on gigabit connections are “trial” connections by service providers. But what the article neglects on is the context: why Australians are always seemingly so special compared with the rest of the world. A inhibitive pricing model.

Where did the pricing go wrong?

I’ve written extensively about the issues with the NBN Connectivity Virtual Circuit (CVC) pricing model. Effectively, providers have to buy virtual bandwidth capacity (CVC) that’s shared across all^ the users from a single retail service provider (RSP).

If a provider buys only 100Mbps of CVC: at any point in time, the sum of all traffic across all users from that RSP will be capped at 100Mbps. It doesn’t matter if the provider has 50 x 100/40Mbps connection, the maximum the provider can transfer across all users is 100Mbps.

The problem is that it is set at an artificially high price to ensure revenue to the NBN company.

This means, to even consider offering gigabit plans, a provider must have enough customers at each point of interconnect to need at least 1Gbps of CVC… which comes in at $17,500 ($17.50 per Mbps before GST).

NBN will soon be introducing dimension-based discounts which will give more generous CVC discounts to providers who buy more CVC on a per-user basis, but it still puts 1Gbps residential plans in the realm of impossibility.

Let me be clear —it’s not that there’s no demand for gigabit plans in the residential market. It is that it is too cost prohibitive and far too risky for providers to offer gigabit services to consumers due to the NBN CVC pricing model.

Under the current pricing model, which to be fair to the current Government, was brought in when the NBN was first introduced by Labor… the NBN rollout must reach critical mass at each point of interconnect and have a significantly reduced cost per Mbps for CVC in order for NBN plans with speeds higher than 100Mbps to start showing up.

Providers overseas, for example AT&T, are offering gigabit services at USD$70 which converts to around AUD$100. With the current CVC model at an arguably high 1:100 contention ration (i.e. 10Mbps of CVC allocated for a 1Gbps connection), NBN costs alone would be over $300. That doesn’t even include interconnection, peering or backhaul costs.

I’ve argued in the past for a different style of dimension-based CVC pricing, where a proportional CVC contribution is paid per end user to make up for the revenue. In turn, NBN will manage the contention.

This would allow providers to offer 1Gbps plans to consumers before the rollout reaches critical mass, and increase the short term revenue for the project if there are more users who take up higher speeds. But such a radical change can’t happen without substantial industry consultation.

Regardless, it is a self-fulling prophecy to say that “there is no demand for gigabit services” when in fact the NBN pricing model is designed to prohibit gigabit services for residential connections.

^ effectively all customers serviced from the same NBN point of interconnect. There are limitations to how many users can be placed on a single CVC and which technologies can share a common CVC, but for all intents and purposes — this is irrelevant for this discussion.

Where’s the demand?

Even if the pricing issue is tacked… you might ask — why would there be demand for gigabit services? QHD content on Netflix only utilises 25Mbps of bandwidth; what applications possibly require more than that? While I can’t possibly accurately predict future applications, there is one obvious demand for high speed: productivity.

As “cloud” storage and computing becomes more and more widely used, there is increased need for burstable Internet connections. As a budding geospatial geek, say I need to transfer a large dataset from my computer to a cloud processing service (conceptually, backing up a large number of photos or videos to cloud storage would be an identical situation).

It would take me no less than 12 hours to transfer a 500GB raster dataset over a 100Mbps connection to my remote server. With a 1Gbps connection, this would reduce to just over an hour.

In this example — I don’t necessarily need the 1Gbps at all time. Perhaps on average, I need no more than a 25Mbps connection. But the productivity gains in having a burstable connection that can reach gigabit speeds when I need it to can be enormous. Rather than sitting and twiddling my thumbs for half a day to wait for my data to be uploaded, and another 12 hours to download it again, I can save some 20-22 hours all up simply by having the connection “on standby” (so to speak).

Infrastructure networks are rarely designed on an “average consumption” basis. If roads and highways, or water and power infrastructure were designed on what happens on “average”, traffic congestion, blackouts and water shortage would be a common problem during peak times.

Good power infrastructure, for example, is designed to cope with sudden demands for electricity. There is phenomena known as “TV Pickup” in the United Kingdom where there is a sudden increase in electricity demand during TV ad breaks — thanks to a large number of people simultaneously turning on the kettle across the UK.

Final words

So, this isn’t simple demand and supply here. Demand is not only driven by users… it is also a function of the NBN’s price structure.

The fact of the matter is, there is far more to the lack of gigabit services than meets the eye initially.

If we are indeed serious about the innovation nation, I call on both side of politics to put down their swords and look seriously at pricing reform for the CVC.  I seriously hope for some bipartisanship… if not at the technology front, then certainly at the pricing policy front.

Detailed analysis: How will Qantas’ on-board Wi-Fi impact NBN satellites?

Geospatial analysis of the daily Qantas flight paths and NBN satellite beam coverage shows how NBN’s satellite network could be affected.

Writer’s note: Qantas is a customer of ViaSat, not NBN Co. ViaSat intends to trial on-board internet using NBN Co’s satellites — however, they have indicated they intend to launch their own satellites (ViaSat-3) to deliver a long-term solution for on-board Wi-Fi globally. This Qantas-ViaSat-NBN Co deal is dependent on industry consultation being completed in June 2016.

Qantas has recently announced that it plans to offer a Wi-Fi service on board its A330 and Boeing 737 fleet from early 2017 by utilising capacity on NBN’s recently launched Sky Muster satellite.  However, many Australians living in rural and regional Australia have raised concerns that the Qantas service will cause further congestion on an already limited service.

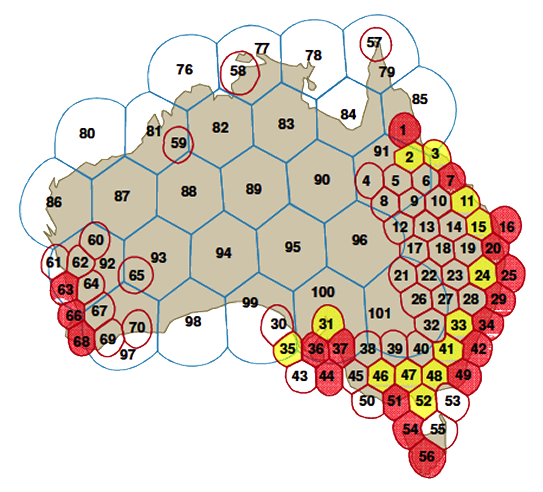
The company responsible for building the National Broadband Network, nbn, had completed a review of satellite capacity in its Fixed Wireless and Satellite review where it identified 31 beams around Australia that would be oversubscribed or severely oversubscribed once a take-up rate of 65% is reached.  As a result, the company will introduce strict Fair Use policies to significantly limit the amount of data to 150 GB (priced at a premium) that can be used by each customer on a 4-week rolling average basis.

Consequently, the Qantas announcement has infuriated many who are within the satellite footprint.  Analysis of flight paths taken by Qantas’ domestic flights using their A330-200, A330-300 and Boeing 737-800 fleets show that all planes fly through at least one congested or severely congested satellite beam.

Key findings:

  • 334 Qantas domestic flights utilise the A330-200, A330-300 and Boeing 737-800 fleet on the day analysed.
  • Every flight flew under at least one oversubscribed or severely oversubscribed beam.
  • 58% of oversubscribed or severely oversubscribed beams will have minimal impact, with at most 2 planes flying under the beam at any given time.
  • The Sydney-Brisbane and Sydney-Gold Coast routes travel entirely within severely oversubscribed NBN Satellite beams (34, 29, 25, 20).
  • The Sydney-Melbourne, Melbourne-Canberra, Sydney-Canberra and Townsville-Brisbane routes travel entirely within oversubscribed OR severely oversubscribed NBN Satellite beams.

Analysis: by congested beams

Over half (58%) of congested beams are not affected or are minimally affected by Qantas planes.  Of the 31 beams considered oversubscribed or severely oversubscribed, 5 of them do not cover any current eligible Qantas flight paths.  7 beams will have at least one flight under the path at some point, and 6 beams will have up to 2 flights under it at the same time (within a 10 minute time frame).

Unsurprisingly however, the beams covering areas immediately surrounding capital cities will have the greatest number of flights under it at any given time:

  • Beam 42 (Sydney Beam) is the worst affected, with up to 7 Qantas flights within a 10 minute time frame travelling under it.
  • Beams 47 (Melbourne Beam) and 20 (Brisbane Beam) come in second, with up to 6 Qantas flights within a 10 minute time frame travelling directly under each of them.
  • Beam 37 (Adelaide Beam) comes in third, with up to 5 Qantas flights within a 10 minute time frame travelling directly under each of them.

It should be noted though, that for the day analysed — the Sydney and Brisbane beams only had the greatest number of flights under it for a single 10 minute time frame (between 8:50am – 9:00am and 7:30pm – 7:40pm respectively).

Finally, by considering the average number of Qantas planes under a beam over a 24 hour period — we see that Beam 47 (Melbourne) tops out at 1.94 planes with Beam 42 (Sydney), Beam 20 (Brisbane) and Beam 41 (Canberra) following closely behind at 1.52, 1.45 and 1.22 planes respectively.

Beam* Max concurrent
flights under beam
(over 10 min period)
%age of time with
at max plane
under beam
%age of time with
at least one plane
under beam
Avg. number of
planes under beam
over 24 hrs
47 (Melbourne) 6 2% 67% 1.94
42 (Sydney) 7 1% 63% 1.52
20 (Brisbane) 6 1% 63% 1.45
41 (Canberra) 4 5% 58% 1.22
37 (Adelaide) 5 1% 49% 0.86
24 (Armidale) 5 1% 53% 0.83
48 (Omeo) 4 1% 51% 0.76
66 (Perth) 3 1% 51% 0.63
34 (Newcastle) 3 3% 40% 0.57
33 (Bathurst) 4 1% 33% 0.48
25 (Grafton) 2 3% 33% 0.37
46 (Ararat) 3 1% 28% 0.36
3 (Townsville) 2 3% 28% 0.31
15 (Wondai) 3 1% 24% 0.30
29 (Port Macquarie) 2 1% 26% 0.27
36 (Yorketown) 3 1% 22% 0.26
35 (Port Lincoln) 2 2% 22% 0.24
7 (Mackay) 2 3% 19% 0.22
11 (Rockhampton) 2 2% 20% 0.22
31 (Whyalla) 1 15% 15% 0.15
44 (Kangaroo Island) 1 8% 8% 0.08
63 (Guilderton) 1 8% 8% 0.08
16 (Maryborough) 1 6% 6% 0.06
2 (Charters Towers) 1 3% 3% 0.03
1 (Cairns) 1 3% 3% 0.03
51 (Geelong) 1 2% 2% 0.02
49 (Bega) 0 0% 0% 0.00
52 (Inverloch) 0 0% 0% 0.00
54 (Burnie) 0 0% 0% 0.00
56 (Hobart) 0 0% 0% 0.00
68 (Bridgetown) 0 0% 0% 0.00

* Beam name is based on a suburb/town/city directly under the beam and may not be the official name used by nbn

Analysis: by flight

Each flight and its flight path were analysed to see which NBN Satellite beam it flies under. The results shows that every single Domestic Qantas A330 and B737 flight flies under at least one oversubscribed or severely oversubscribed satellite beam.

The most prominent are the Sydney-Brisbane and Sydney-Gold Coast routes, which flies entirely within severely oversubscribed beams (that’s beams 34, 29, 25, 20).  Sydney-Melbourne, Melbourne-Canberra, Sydney-Canberra and Townsville-Brisbane routes fly entirely through oversubscribed or severely oversubscribed beams.

For the full analysis output, click here!

Concluding thoughts…

I find the results of this analysis somewhat inconclusive. Firstly, unlike domestic US services — the number of Qantas flights expected to get the Wi-Fi service is quite small.

With under 350 flights spread out geographically and over a 24 hour period, I doubt the planes would have a material effect on congestion. Currently, the worst case scenario seems to be up 6-7 planes flying under a single beam at any given time. However, in the case of the 7-plane statistic, it happens only once in a 24 hour period. The speed at which planes travel also mean that they will typically fly in and out of narrow beams within 10-15 minutes, meaning any impact should be distributed across multiple beams as the plane flies through the airspace.

On the other hand, the bulk of the flights will fly under already oversubscribed areas. This is especially true for the beams serving the areas immediately surrounding the capital cities, which are all severely oversubscribed (bar-Darwin). These areas also have the greatest number of concurrent flights, represented by the “average number of planes over 24 hours” statistic.

So, no. I don’t think there’s an immediate threat to congestion. However, it does set a precedent. If more carriers get on board… and if international flights get added to the pool as well — things could well change in the future.

NBN Long Term Satellite beams
Diagram showing NBN Co satellite beams and risk of congestion as determined in the Fixed Wireless/Satellite Strategic Review (FWSat SR).

Assumptions made in this analysis:

  • The flight data analysed was from Wednesday, 23rd Feb 2016.
  • Qantas will only install the Satellite-powered Wi-Fi solution on their A330-200, A330-300 and Boeing 737-800 fleet.
  • In all cases where the plane transverses an area with both a wide and narrow beam, the congested, narrow beam is selected.
  • Plane locations are calculated in 10 minute intervals.
  • Congestion (oversubscribed beams) are based on results in the NBN Fixed Wireless and Satellite Review.
nbn™ logo (large)

Analysis: Is privatising the Multi-Technology Mix the best way forward?

With almost no competition to incentivise an upgrade to its network, can NBN’s monopoly Multi-Technology Mix keep up with user demands or will it become Telstra 2.0?

Infrastructure Australia released it’s “Australian Infrastructure Plan” report today. It’s contents are not exclusively about the National Broadband Network, however, it made a number of recommendations to the Government suggesting that the NBN should be privatised in the medium term.

A bit of background: the fibre monopoly

Since the conception of the National Broadband Network, there had always been a plan and provision to sell company once the rollout is complete. With the original “full fibre” plan envisaged by the then-Labor Government, selling or not selling the fibre network at completion wouldn’t materially affect competition.

Fibre at the premises level is a natural infrastructure monopoly. Much like how water supply companies do not build competing sets of pipes for competition, fibre is effectively a pipe with limitless upgrade opportunities by simply “swapping out the equipment at each end”. It is vastly inefficient to duplicate networks for the sake of competition, and the Optus and Telstra HFC “war” in the 90s was an excellent example of how broadband infrastructure competition can fail.

There is a case for small amounts of network duplication in inner metropolitan areas. However, it becomes hard to compete (at least within the fixed-line space) with a network that’s already built to the scale that NBN would have.

Selling, or even long term (99 year) leases of the fibre network based on geographical areas would have made sense. Like water companies, telco infrastructure entities wouldn’t spend too much time duplicating each other’s network. Upgrading networks to user demands would incur minimal capital expenditure, as it’s a matter of swapping equipment at two ends. Competition will continue to exist, but only in the retail/service delivery component of the network by Internet Service Providers.

The Multi-Technology Mix

But things changed. If you haven’t noticed, the NBN is no longer rolling out fibre to the majority of premises. The Coalition Government’s policy of a Multi-Technology Mix fixed-line network creates new challenges policy makers in the future will need to deliberate carefully before pressing sell in parliament.

On the upside, a Multi-Technology Mix is an effective way to drive infrastructure competition. However, it doesn’t work when it’s being built by a single entity — especially not a Government-owned enterprise.

No incentive to upgrade, unless split up and privatised

As a monopoly, investing large sums of money on upgrading technologies like VDSL2 over copper where upgrade paths is not as simple as “swapping out equipment” presents an ongoing burden for the NBN company. As user bandwidth demand grows, many telecommunications companies would upgrade and extend their networks to meet user demand. Or else, they would risk a competitor coming in to take over their market share. That’s what happens in areas with healthy infrastructure competition — such as Hong Kong.

But like Telstra before it, NBN wouldn’t have a business case to upgrade its networks — even if user demands skyrocket. The company would stand to lose money (at least in the short-term) by investing to upgrade its network, while it would keep a steady revenue if it just maintained the network as it is and not upgrading at all! Civil costs to push fibre out further into the field to meet user demand isn’t cheap, especially when it’s done in successive truck rolls (which is what the current policy is).

We can say that the current NBN policy focuses on short-term policy objectives — lowering the short-term capital expenditure costs, while risking medium to long-term operation costs — in other words, leaving it for policymakers of the future to deal with.

Privatising the Multi-Technology Mix by its technologies would make sense — provided the necessary regulatory instruments were put in place. Consider privatisation by splitting the NBN into a FTTx, HFC and Wireless/Terrestrial entities. These three entities could lend themselves to infrastructure competition in areas where there is sufficient network overlap. In metro areas for example, failure to upgrade the copper-based VDSL2 solution used by the FTTx entity would see the threat of an adjacent HFC footprint grow to meet user demand (and vice versa).

In regional and rural areas, the viability of infrastructure competition is not immediately obvious. Improvements in fixed wireless technologies could threaten the market share of the FTTx entity, but the fixed wireless network would need to grow substantially to be of real competition. In addition, wireless and terrestrial (satellite) solutions tend to be more expensive. So is it possible to create healthy competition, or would those areas have to rely on Government subsidies to promote upgrades?

Even if competitors are identified, each of these entity would need to have equal opportunity to grow its footprint into their competitor’s existing footprint. Having equal access to things like duct and pipe, Tier 1 and Tier 2 facilities, power and potentially many more aspects is crucial before any privatisation goes ahead.

Then there’s the issue of vertical integration

Looking at the current telco market in Australia, obvious candidates with enough capital for purchasing parts of a privatised NBN would be Telstra, Optus, the TPG Group and the M2 Group. Companies like Nextgen or Vodafone could still take a share.

But all these companies I’ve listed, bar Nextgen, already hold a retail front: Telstra, Optus, TPG and Vodafone are obvious by name. M2 owns Dodo and iPrimus.

Currently, the unique nature of NBN is that it is entirely wholesale only with no vertical integration, driving substantial retail competition in the service provider front. In my opinion, this needs to stay as is. Infrastructure companies should stay structurally separated from its retail front to ensure innovation within the “service” sector and ensures equal pricing regardless of who owns the network.


Conclusion

In a privatised world without a ubiquitous network of natural monopoly (like fibre), the only way networks will meet user demand is by infrastructure competition. Infrastructure competition requires network duplication (or at least the threat of) to stimulate investment to upgrade. So the question is: do we want this duplication? Isn’t it blindingly inefficient to have networks that do the same thing being built two or three times over just to keep with user demand?

I think we’ve put ourselves in another telecommunications policy nightmare in Australia. Time and time again, successive Governments — in their short sightedness — have failed to realise the consequences of their policy decisions. The NBN was meant to solve the issue of a lack of infrastructure investment that resulted from the privatisation of Telstra. It still could, but potentially at the cost of inefficient network duplication.

Yes, I’d still argue that a Fibre to the Premises model would have been the ideal model. It would have made privatisation easier, it would have been far more elegant. But what’s done is done.

Some would argue it’s a good thing. Infrastructure competition could work well for companies who have substantial capital while also owning large amounts of existing network assets.

Currently, TPG is the disrupter in the market. The rollout of inner-city Fibre to the Basement network is a good example of what healthy infrastructure competition could look like.

So yes, in conclusion, if done correctly — splitting and selling the NBN is probably the best way forward for Australia. But as Malcolm would say, “it’s not the way we would have done it”.

What do you think?