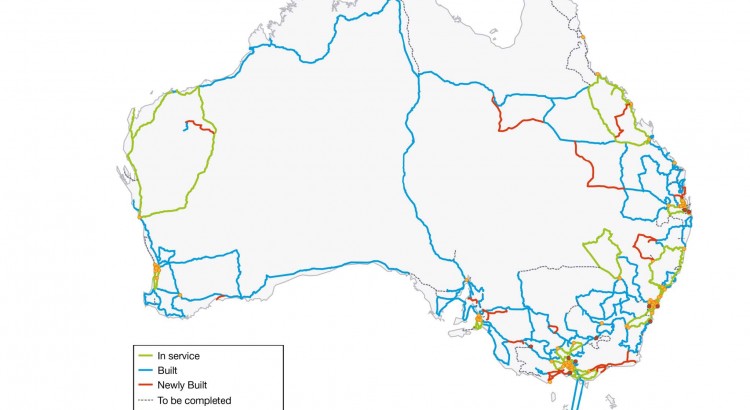
NBN Co released their new multi-technology “rollout plan” for a forward looking plan of the next 18 months. In their limited rollout plan release, which bares little resemblance or detail previously seen in NBN rollout plans, the company lists the area and the technology planned for use in their 18 month forward plan.
The plan lists on a suburb level, the number of premises NBN Co plans to pass within the next 18 months. It also lists the possible technology types (Fibre to the Premises, Multi-Technology Mix, or Wireless) but does not indicate which (nor how many) premises are covered by which technology.
In usual NBN Co style, the file was published in a stupidly inaccessible format (PDF) — see my complaints here. The official response I got for this format was “to ensure the integrity of our data”… but by exporting the spreadsheet as a PDF, it means the integrity of the data is highly compromised given anyone who wants to do something useful with the data would need to go through a massive amount of conversion needed to get it in a usable format. Given the statement of expectation’s requirement for NBN Co to be transparent, publishing PDF files is clearly just a deterrent for the public to analyse information.
Anyway, I spent a good hour or so putting the data back into an Excel spreadsheet for easier consumption. You can find that here.
Now that I put it all back into an Excel spreadsheet, I was able to do a quick analysis of the technology breakdown (sorta):
Technology Breakdown
| Technology | Premises |
|---|---|
| FTTP Only | 161,000 |
| MTM Only | 1,383,900 |
| Either FTTP/MTM | 243,000 |
| Fixed-line Total | 1,787,900 |
| Fixed Wireless | 126,600 |
| Total | 1,914,500 |
Also — almost seemly as an afterthought, NBN Co reveals at the bottom of their press release that their rollout plan includes 19% underserved areas vs a nation-wide figure of 16%.
