Detailed analysis: How will Qantas’ on-board Wi-Fi impact NBN satellites?

Geospatial analysis of the daily Qantas flight paths and NBN satellite beam coverage shows how NBN’s satellite network could be affected.

Writer’s note: Qantas is a customer of ViaSat, not NBN Co. ViaSat intends to trial on-board internet using NBN Co’s satellites — however, they have indicated they intend to launch their own satellites (ViaSat-3) to deliver a long-term solution for on-board Wi-Fi globally. This Qantas-ViaSat-NBN Co deal is dependent on industry consultation being completed in June 2016.

Qantas has recently announced that it plans to offer a Wi-Fi service on board its A330 and Boeing 737 fleet from early 2017 by utilising capacity on NBN’s recently launched Sky Muster satellite.  However, many Australians living in rural and regional Australia have raised concerns that the Qantas service will cause further congestion on an already limited service.

The company responsible for building the National Broadband Network, nbn, had completed a review of satellite capacity in its Fixed Wireless and Satellite review where it identified 31 beams around Australia that would be oversubscribed or severely oversubscribed once a take-up rate of 65% is reached.  As a result, the company will introduce strict Fair Use policies to significantly limit the amount of data to 150 GB (priced at a premium) that can be used by each customer on a 4-week rolling average basis.

Consequently, the Qantas announcement has infuriated many who are within the satellite footprint.  Analysis of flight paths taken by Qantas’ domestic flights using their A330-200, A330-300 and Boeing 737-800 fleets show that all planes fly through at least one congested or severely congested satellite beam.

Key findings:

  • 334 Qantas domestic flights utilise the A330-200, A330-300 and Boeing 737-800 fleet on the day analysed.
  • Every flight flew under at least one oversubscribed or severely oversubscribed beam.
  • 58% of oversubscribed or severely oversubscribed beams will have minimal impact, with at most 2 planes flying under the beam at any given time.
  • The Sydney-Brisbane and Sydney-Gold Coast routes travel entirely within severely oversubscribed NBN Satellite beams (34, 29, 25, 20).
  • The Sydney-Melbourne, Melbourne-Canberra, Sydney-Canberra and Townsville-Brisbane routes travel entirely within oversubscribed OR severely oversubscribed NBN Satellite beams.

Analysis: by congested beams

Over half (58%) of congested beams are not affected or are minimally affected by Qantas planes.  Of the 31 beams considered oversubscribed or severely oversubscribed, 5 of them do not cover any current eligible Qantas flight paths.  7 beams will have at least one flight under the path at some point, and 6 beams will have up to 2 flights under it at the same time (within a 10 minute time frame).

Unsurprisingly however, the beams covering areas immediately surrounding capital cities will have the greatest number of flights under it at any given time:

  • Beam 42 (Sydney Beam) is the worst affected, with up to 7 Qantas flights within a 10 minute time frame travelling under it.
  • Beams 47 (Melbourne Beam) and 20 (Brisbane Beam) come in second, with up to 6 Qantas flights within a 10 minute time frame travelling directly under each of them.
  • Beam 37 (Adelaide Beam) comes in third, with up to 5 Qantas flights within a 10 minute time frame travelling directly under each of them.

It should be noted though, that for the day analysed — the Sydney and Brisbane beams only had the greatest number of flights under it for a single 10 minute time frame (between 8:50am – 9:00am and 7:30pm – 7:40pm respectively).

Finally, by considering the average number of Qantas planes under a beam over a 24 hour period — we see that Beam 47 (Melbourne) tops out at 1.94 planes with Beam 42 (Sydney), Beam 20 (Brisbane) and Beam 41 (Canberra) following closely behind at 1.52, 1.45 and 1.22 planes respectively.

Beam* Max concurrent
flights under beam
(over 10 min period)
%age of time with
at max plane
under beam
%age of time with
at least one plane
under beam
Avg. number of
planes under beam
over 24 hrs
47 (Melbourne) 6 2% 67% 1.94
42 (Sydney) 7 1% 63% 1.52
20 (Brisbane) 6 1% 63% 1.45
41 (Canberra) 4 5% 58% 1.22
37 (Adelaide) 5 1% 49% 0.86
24 (Armidale) 5 1% 53% 0.83
48 (Omeo) 4 1% 51% 0.76
66 (Perth) 3 1% 51% 0.63
34 (Newcastle) 3 3% 40% 0.57
33 (Bathurst) 4 1% 33% 0.48
25 (Grafton) 2 3% 33% 0.37
46 (Ararat) 3 1% 28% 0.36
3 (Townsville) 2 3% 28% 0.31
15 (Wondai) 3 1% 24% 0.30
29 (Port Macquarie) 2 1% 26% 0.27
36 (Yorketown) 3 1% 22% 0.26
35 (Port Lincoln) 2 2% 22% 0.24
7 (Mackay) 2 3% 19% 0.22
11 (Rockhampton) 2 2% 20% 0.22
31 (Whyalla) 1 15% 15% 0.15
44 (Kangaroo Island) 1 8% 8% 0.08
63 (Guilderton) 1 8% 8% 0.08
16 (Maryborough) 1 6% 6% 0.06
2 (Charters Towers) 1 3% 3% 0.03
1 (Cairns) 1 3% 3% 0.03
51 (Geelong) 1 2% 2% 0.02
49 (Bega) 0 0% 0% 0.00
52 (Inverloch) 0 0% 0% 0.00
54 (Burnie) 0 0% 0% 0.00
56 (Hobart) 0 0% 0% 0.00
68 (Bridgetown) 0 0% 0% 0.00

* Beam name is based on a suburb/town/city directly under the beam and may not be the official name used by nbn

Analysis: by flight

Each flight and its flight path were analysed to see which NBN Satellite beam it flies under. The results shows that every single Domestic Qantas A330 and B737 flight flies under at least one oversubscribed or severely oversubscribed satellite beam.

The most prominent are the Sydney-Brisbane and Sydney-Gold Coast routes, which flies entirely within severely oversubscribed beams (that’s beams 34, 29, 25, 20).  Sydney-Melbourne, Melbourne-Canberra, Sydney-Canberra and Townsville-Brisbane routes fly entirely through oversubscribed or severely oversubscribed beams.

For the full analysis output, click here!

Concluding thoughts…

I find the results of this analysis somewhat inconclusive. Firstly, unlike domestic US services — the number of Qantas flights expected to get the Wi-Fi service is quite small.

With under 350 flights spread out geographically and over a 24 hour period, I doubt the planes would have a material effect on congestion. Currently, the worst case scenario seems to be up 6-7 planes flying under a single beam at any given time. However, in the case of the 7-plane statistic, it happens only once in a 24 hour period. The speed at which planes travel also mean that they will typically fly in and out of narrow beams within 10-15 minutes, meaning any impact should be distributed across multiple beams as the plane flies through the airspace.

On the other hand, the bulk of the flights will fly under already oversubscribed areas. This is especially true for the beams serving the areas immediately surrounding the capital cities, which are all severely oversubscribed (bar-Darwin). These areas also have the greatest number of concurrent flights, represented by the “average number of planes over 24 hours” statistic.

So, no. I don’t think there’s an immediate threat to congestion. However, it does set a precedent. If more carriers get on board… and if international flights get added to the pool as well — things could well change in the future.
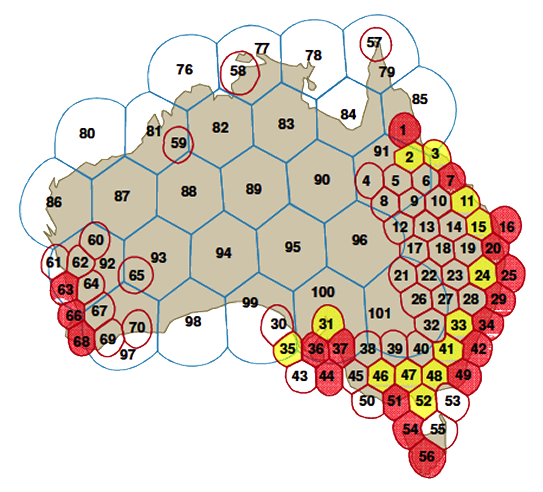
NBN Long Term Satellite beams
Diagram showing NBN Co satellite beams and risk of congestion as determined in the Fixed Wireless/Satellite Strategic Review (FWSat SR).

Assumptions made in this analysis:

  • The flight data analysed was from Wednesday, 23rd Feb 2016.
  • Qantas will only install the Satellite-powered Wi-Fi solution on their A330-200, A330-300 and Boeing 737-800 fleet.
  • In all cases where the plane transverses an area with both a wide and narrow beam, the congested, narrow beam is selected.
  • Plane locations are calculated in 10 minute intervals.
  • Congestion (oversubscribed beams) are based on results in the NBN Fixed Wireless and Satellite Review.
NBN Long Term Satellite restrictions: revealed

nbn proposes standard 75GB data cap per month with 100GB and 150GB premium options to ensure satellites aren’t congested.

On Friday, nbn, the company responsible for building the National Broadband Network, released draft documents relating to the NBN Co Satellite Network set to launch in the second quarter of next year as part of the Satellite Trial Product Agreement.  The documents (see bottom of page) reveal a number of measures and restrictions expected to be taken by the company to prevent excessive use of data by end users.

CVC Classes

nbn will be introducing a concept called CVC Classes, which are essentially different levels of service on the NBN Co Satellite Network.  There are three classes, starting with the standard CVC Class 0, plus two additional premium CVC Classes — 1 and 2.  These classes are costed differently, have a different maximum contention ratio and have a different maximum data usage cap.

Cost

Cost-wise, the company will charge service providers an extra $18.00 and $40.00 ex. GST per Access Virtual Circuit (essentially, per end-user) for CVC Class 1 and 2 respectively on top of the existing AVC and CVC costs.  CVC Class 0 will have no additional charge.

The following table shows the AVC + CVC Class Fee. (Note: this is not representative of the cost of NBN Satellite plans.  Actual costs are likely to be higher as this excludes any CVC, NNI, network transit and peering costs incurred by Service Providers).

CVC Class CVC Class Fee AVC TC-4
12/1 Mbps
AVC+CVC Fee
(12/1 Mbps)
AVC TC-4
25/5 Mbps
AVC+CVC Fee
(25/5 Mbps)
0 $0.00 $24.00 $24.00 $27.00 $27.00
1 $18.00 $24.00 $42.00 $27.00 $45.00
2 $40.00 $24.00 $64.00 $27.00 $67.00

Data usage caps

On the data usage cap side, the company is two key enforcement metrics across all classes.  As part of the Fair Use Policy, nbn will introduce a per-AVC (essentially, per end-user) cap calculated on a rolling 4 week average basis.  The maximum usage over the four weeks are 75 GB, 100 GB and 150 GB for CVC Class 0, 1 and 2 respectively.  This is compared to 50 GB currently being enforced on the nbn Interim Satellite Service.

A second data usage enforcement metric is the “Peak Period” usage, which is calculated as an average across the Service Provider’s CVC Class user base.  During this peak period, defined as being between 7:00 am to 1:00 am (the following day) in the local timezone of the premises — the average upload/download data usage across all the ISP’s CVC Class users is 15/3GB, 20/4GB and 25/5GB for CVC Class 0, 1 and 2 respectively.

CVC Class AVC+CVC Fee
(25/5 Mbps)*
User data cap
(4-week rolling avg)
Peak Period Download
(ISP 4-wk average)
Peak Period Upload
(ISP 4-wk average)
0 $27.00 75 GB 15 GB 3 GB
1 $45.00 100 GB 20 GB 4 GB
2 $67.00 150 GB 25 GB 5 GB

* this is not representative of the cost of NBN Satellite plans.  Actual costs are likely to be higher as this excludes any CVC, NNI, network transit and peering costs incurred by Service Providers.

Failure for the service provider to comply with the data usage caps could result in data deprioritisation by nbn and/or shaping upload and download speeds to 256/256kbps until the issue is resolved.

Contention ratios

nbn will also place restrictions on the CVC-to-AVC contention ratio, enforcing a minimum number of end users a service provider must have on a particular CVC before allowing them to step up to the next tier.

On a CVC Class 0 CVC, the CVC capacity can range from the initial 100 Mbps up to 475 Mbps in 25 Mbps intervals.  The service provider must have at least 890 AVCs (equivalent to users) in that CVC Class in order to increase their CVC capacity beyond the initial 100 Mbps. A minimum of 210 additional AVCs are required for each 25 Mbps capacity increase.

For CVC Class 1, the maximum CVC capacity is 550 Mbps.  To move beyond the initial 100 Mbps CVC, the service provider must have at least 680 AVCs and can increase in 25 Mbps intervals for every 195 AVCs.

CVC Class 2 CVCs have a maximum CVC capacity is 725 Mbps.  Moving beyond the initial 100 Mbps CVC would require 548 AVCs and 25 Mbps increases for every 142 AVCs.

CVC Class Maximum CVC (Mbps) Minimum AVCs
(end-users) required
to move beyond
initial 100 Mbps
AVCs (end-users)
required for each
25 Mbps interval
beyond 100 Mbps
0 475 890 210
1 550 680 195
2 735 548 142

For assuming the 12/1 Mbps tier across all users: CVC class 0 provides a minimum contention ratio of ~1:106 with CVC class 1 and CVC Class 2 requiring a minimum contention of ~1:81 and ~1:68 respectively.

thoughts & analysis

Managing satellite network traffic has always been a tricky issue.  One one hand, the company doesn’t want to be perceived as disadvantaging rural and regional areas.  On the other hand, it is a necessity to make sure the service isn’t so heavily congested that no-one can use it.

The Interim Satellite Service was a good learning experience for nbn.  Service providers wanted to offer their users “unlimited” or high quota plans, thinking it could be offset by many more low-usage users.  They soon realised that the providers were unable to manage their own capacity well enough and soon, implemented traffic management policies to help manage the overly congested 48,000 users on the limited existing capacity of Optus and IPStar.

The limitations set by nbn are complex, there’s no doubt about that.  There are more intricacies that are omitted in this post — simply because they are too hard to explain simply.  These complexities means that small RSPs may struggle with implementing the traffic limiters and monitoring tools required to meet nbn‘s strict policies.  This could result in reduced competition in the long run.

On the quota…


Read updated analysis

Note from the writer: Please take this section with a grain of salt.  My views have changed substantially since this section was written because I had assumed that an end user could actually access all of the 75GB, 100GB and 150GB of data on CVC Class 0, 1 and 2 respectively.  However, it is now evident to me that the Fair Use Policy has implications on time of use and doesn’t account for data incurred during shaped data usage.  Please read the updated analysis for more information.

So, will 75 GB on a rolling 4-week average be enough? As a standard quota, I think it will fit within most people’s needs.

Currently, NBN offers 50 GB on a 4-week rolling average to their Interim Satellite Service.  So, 75 GB may seem like a small bump — but it’s 50% more nonetheless.

To keep things in perspective, statistics released by ABS show the average data consumption across all fixed-line technologies (end of 2014) is around 60 GB.  Further to that, the statistics released by nbn in their end of FY14/15 shows average data consumption on the NBN has steadily risen from 80 GB in September 2014 to 109 GB in June 2015.  So on an average consumption basis, I think the 75 GB monthly quota would fit the bill for most people.

So while nbn would expect most customers who take up a standard-tier 75 GB plan, the option is there to bump it up to 150 GB which is technically above the 109 GB average for current fixed-line/fixed-wireless nbn end users.

We also need to consider the demographic of the majority of these users: they live in very rural or remote communities.  Most regional centres are serviced by NBN Fixed Wireless and some form of NBN Fixed-line technology.  The remaining of these customers would have previously had very limited Internet connectivity, if any.

The standard 75 GB, plus the option of the more expensive 100 and 150 GB tiers will provide these rural communities with more than just a taste of online connectivity.  It will give users access to services like email and YouTube, and perhaps even more revolutionary — access to video conferencing through the likes of Skype or access to massive libraries of online TV content on Netflix, Presto or Stan.  All this will be possible within the confines of 75 GB, provided image quality is throttled accordingly.

Ideally, of course, each user should be given more capacity.  Hopefully, with the launch of the second satellite, nbn is able to augment some of the redundancy capacity on that satellite to use as more bandwidth for each user.

Relevant documents

[Source: nbn Testing Arrangements, Satellite Trial Product Terms supporting documentation]

nbn™ proposes satellite fees: rural customers lose out again

nbn™ has clarified some of the contents of the original post. The post has been updated in light of this new information.

As part of nbn™’s industry consultation on the Long Term Satellite Service launching next year, the company released a list of proposed charges for the satellite service to Access Seekers (service providers) for feedback last Friday. A summary table was released to the public this morning.

The table lists a number of new proposed charges, including a reactivation fee, installation, installer travel costs and a range of late or missed appointment fees.

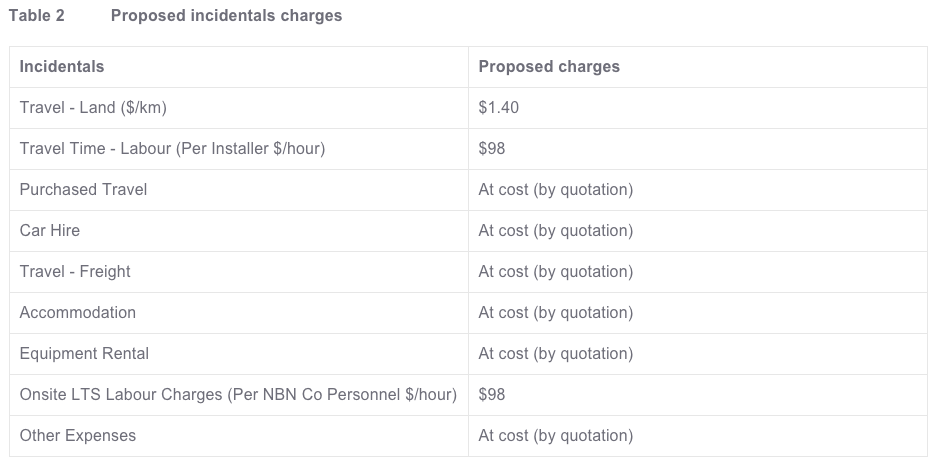
Proposed incidentals charges for NBN Long Term Satellite
Table 2: showing some proposed charges for the NBN Long Term Satellite

Under the proposed charges, the company will charge the customer through the internet service provider an installation fee based on the distance the installer has to travel (charged at $1.40/km) and also pay an hourly rate for the time they spent driving and installing the equipment (at $98/hour). This is in contrast with nbn™’s current cost structure for the Fixed Wireless and Fixed-Line products where the installation is free for the customer.

(more…)