Detailed analysis: How will Qantas’ on-board Wi-Fi impact NBN satellites?

Geospatial analysis of the daily Qantas flight paths and NBN satellite beam coverage shows how NBN’s satellite network could be affected.

Writer’s note: Qantas is a customer of ViaSat, not NBN Co. ViaSat intends to trial on-board internet using NBN Co’s satellites — however, they have indicated they intend to launch their own satellites (ViaSat-3) to deliver a long-term solution for on-board Wi-Fi globally. This Qantas-ViaSat-NBN Co deal is dependent on industry consultation being completed in June 2016.

Qantas has recently announced that it plans to offer a Wi-Fi service on board its A330 and Boeing 737 fleet from early 2017 by utilising capacity on NBN’s recently launched Sky Muster satellite.  However, many Australians living in rural and regional Australia have raised concerns that the Qantas service will cause further congestion on an already limited service.

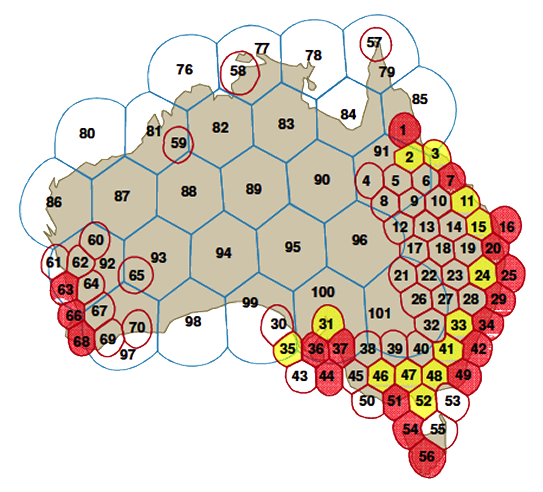
The company responsible for building the National Broadband Network, nbn, had completed a review of satellite capacity in its Fixed Wireless and Satellite review where it identified 31 beams around Australia that would be oversubscribed or severely oversubscribed once a take-up rate of 65% is reached.  As a result, the company will introduce strict Fair Use policies to significantly limit the amount of data to 150 GB (priced at a premium) that can be used by each customer on a 4-week rolling average basis.

Consequently, the Qantas announcement has infuriated many who are within the satellite footprint.  Analysis of flight paths taken by Qantas’ domestic flights using their A330-200, A330-300 and Boeing 737-800 fleets show that all planes fly through at least one congested or severely congested satellite beam.

Key findings:

  • 334 Qantas domestic flights utilise the A330-200, A330-300 and Boeing 737-800 fleet on the day analysed.
  • Every flight flew under at least one oversubscribed or severely oversubscribed beam.
  • 58% of oversubscribed or severely oversubscribed beams will have minimal impact, with at most 2 planes flying under the beam at any given time.
  • The Sydney-Brisbane and Sydney-Gold Coast routes travel entirely within severely oversubscribed NBN Satellite beams (34, 29, 25, 20).
  • The Sydney-Melbourne, Melbourne-Canberra, Sydney-Canberra and Townsville-Brisbane routes travel entirely within oversubscribed OR severely oversubscribed NBN Satellite beams.

Analysis: by congested beams

Over half (58%) of congested beams are not affected or are minimally affected by Qantas planes.  Of the 31 beams considered oversubscribed or severely oversubscribed, 5 of them do not cover any current eligible Qantas flight paths.  7 beams will have at least one flight under the path at some point, and 6 beams will have up to 2 flights under it at the same time (within a 10 minute time frame).

Unsurprisingly however, the beams covering areas immediately surrounding capital cities will have the greatest number of flights under it at any given time:

  • Beam 42 (Sydney Beam) is the worst affected, with up to 7 Qantas flights within a 10 minute time frame travelling under it.
  • Beams 47 (Melbourne Beam) and 20 (Brisbane Beam) come in second, with up to 6 Qantas flights within a 10 minute time frame travelling directly under each of them.
  • Beam 37 (Adelaide Beam) comes in third, with up to 5 Qantas flights within a 10 minute time frame travelling directly under each of them.

It should be noted though, that for the day analysed — the Sydney and Brisbane beams only had the greatest number of flights under it for a single 10 minute time frame (between 8:50am – 9:00am and 7:30pm – 7:40pm respectively).

Finally, by considering the average number of Qantas planes under a beam over a 24 hour period — we see that Beam 47 (Melbourne) tops out at 1.94 planes with Beam 42 (Sydney), Beam 20 (Brisbane) and Beam 41 (Canberra) following closely behind at 1.52, 1.45 and 1.22 planes respectively.

Beam* Max concurrent
flights under beam
(over 10 min period)
%age of time with
at max plane
under beam
%age of time with
at least one plane
under beam
Avg. number of
planes under beam
over 24 hrs
47 (Melbourne) 6 2% 67% 1.94
42 (Sydney) 7 1% 63% 1.52
20 (Brisbane) 6 1% 63% 1.45
41 (Canberra) 4 5% 58% 1.22
37 (Adelaide) 5 1% 49% 0.86
24 (Armidale) 5 1% 53% 0.83
48 (Omeo) 4 1% 51% 0.76
66 (Perth) 3 1% 51% 0.63
34 (Newcastle) 3 3% 40% 0.57
33 (Bathurst) 4 1% 33% 0.48
25 (Grafton) 2 3% 33% 0.37
46 (Ararat) 3 1% 28% 0.36
3 (Townsville) 2 3% 28% 0.31
15 (Wondai) 3 1% 24% 0.30
29 (Port Macquarie) 2 1% 26% 0.27
36 (Yorketown) 3 1% 22% 0.26
35 (Port Lincoln) 2 2% 22% 0.24
7 (Mackay) 2 3% 19% 0.22
11 (Rockhampton) 2 2% 20% 0.22
31 (Whyalla) 1 15% 15% 0.15
44 (Kangaroo Island) 1 8% 8% 0.08
63 (Guilderton) 1 8% 8% 0.08
16 (Maryborough) 1 6% 6% 0.06
2 (Charters Towers) 1 3% 3% 0.03
1 (Cairns) 1 3% 3% 0.03
51 (Geelong) 1 2% 2% 0.02
49 (Bega) 0 0% 0% 0.00
52 (Inverloch) 0 0% 0% 0.00
54 (Burnie) 0 0% 0% 0.00
56 (Hobart) 0 0% 0% 0.00
68 (Bridgetown) 0 0% 0% 0.00

* Beam name is based on a suburb/town/city directly under the beam and may not be the official name used by nbn

Analysis: by flight

Each flight and its flight path were analysed to see which NBN Satellite beam it flies under. The results shows that every single Domestic Qantas A330 and B737 flight flies under at least one oversubscribed or severely oversubscribed satellite beam.

The most prominent are the Sydney-Brisbane and Sydney-Gold Coast routes, which flies entirely within severely oversubscribed beams (that’s beams 34, 29, 25, 20).  Sydney-Melbourne, Melbourne-Canberra, Sydney-Canberra and Townsville-Brisbane routes fly entirely through oversubscribed or severely oversubscribed beams.

For the full analysis output, click here!

Concluding thoughts…

I find the results of this analysis somewhat inconclusive. Firstly, unlike domestic US services — the number of Qantas flights expected to get the Wi-Fi service is quite small.

With under 350 flights spread out geographically and over a 24 hour period, I doubt the planes would have a material effect on congestion. Currently, the worst case scenario seems to be up 6-7 planes flying under a single beam at any given time. However, in the case of the 7-plane statistic, it happens only once in a 24 hour period. The speed at which planes travel also mean that they will typically fly in and out of narrow beams within 10-15 minutes, meaning any impact should be distributed across multiple beams as the plane flies through the airspace.

On the other hand, the bulk of the flights will fly under already oversubscribed areas. This is especially true for the beams serving the areas immediately surrounding the capital cities, which are all severely oversubscribed (bar-Darwin). These areas also have the greatest number of concurrent flights, represented by the “average number of planes over 24 hours” statistic.

So, no. I don’t think there’s an immediate threat to congestion. However, it does set a precedent. If more carriers get on board… and if international flights get added to the pool as well — things could well change in the future.

NBN Long Term Satellite beams
Diagram showing NBN Co satellite beams and risk of congestion as determined in the Fixed Wireless/Satellite Strategic Review (FWSat SR).

Assumptions made in this analysis:

  • The flight data analysed was from Wednesday, 23rd Feb 2016.
  • Qantas will only install the Satellite-powered Wi-Fi solution on their A330-200, A330-300 and Boeing 737-800 fleet.
  • In all cases where the plane transverses an area with both a wide and narrow beam, the congested, narrow beam is selected.
  • Plane locations are calculated in 10 minute intervals.
  • Congestion (oversubscribed beams) are based on results in the NBN Fixed Wireless and Satellite Review.
NBN Fibre to the Node Trial at Umina Beach

nbn’s right: users probably not affected by node congestion

nbn has strongly refuted suggestions that their node’s backhaul link is already hitting capacity, and figures seem to match their assertion.

(analysis) The company responsible for building the National Broadband Network, nbn, has refuted claims that backhaul congestion is the primary cause of slow speeds experienced by users on its recently-launched Fibre to the Node network. As a matter of distinction, this is separate from the blog post I wrote 7 months ago about long-term capacity challenges faced by nbn.  In this post, we are discussing congestion issues faced by current customers.

If we examine the figures closely, there simply isn’t enough customers on each node (yet) to need to worry about backhaul congestion yet.  In raw numbers, the lucky chaps in Belmont North connected to node 10 in Belmont 7 (2BLT-07-10) had just a smidgen under 100 premises connected at the start of this month.  This is followed closely by node 5 in Belmont 5 and node 2 in Belmont 1 in the raw take-up of high 80s.

Node (ADA) ID Node premises count Currently active premises
2BLT-07-10 233 93
2BLT-05-05 247 88
2BLT-01-02 226 84
2GRK-02-11 273 83
2BLT-10-08 246 82
2BLT-07-07 210 81
2BLT-07-17 233 80

If we consider the FTTN AVC profile revealed in estimates (13% on 12/1 Mbps, 50% on 25/5 Mbps, 25% on 50/20 Mbps and 12% on 100/40 Mbps), we can consider an aggregate average downlink AVC of roughly 39 Mbps per FTTN user.  At roughly 100 per node sharing 1GE uplink fibre, even during full saturation — each user would get on average an uncontended 10 Mbps link.  That’s better than a 1:4 contention ratio — well above most, if not all, residential-grade services.

Of course, I’m not privy to NBN’s network utilisation graphs.  But I’m fairly confident that they will show in each node, there is currently plenty of buffer space.

As I’ve said in an earlier blog post, node-based congestion can really only be expected during peak times on a fully loaded node.  Without wider saturation of 4K TVs at this point in time, the entire neighborhood of 100 premises must stream at least 2 HD Netflix or YouTube video simultaneously before there starts to be congestion issues — a virtually impossible scenario.

We don’t know what may happen in the future. Perhaps when 4K becomes more mainstream, it will become an issue.  The scenario I posed was 25% of customers simultaneously streaming 4K is all it would take to congest a full loaded node.  But at least for now, it’s pretty safe to say that this particular factor is not major concern.

So if it’s not node backhaul, what is it?

It must suck to be in this situation currently.  When you have end users posting speed tests well below 10 Mbps download “consistently”, you know there is an issue somewhere. Whether it’s a sync speed issue, CVC underprovisioning, packets being dropped by nbn somewhere within the network or something else altogether — testimony given by CEO Bill Morrow at the recent Senate Estimates suggests that nbn and service providers are working through it bit by bit to diagnose.  One thing’s for sure, it’s most probably nothing to do with node backhaul congestion yet.

Inside an NBN node at Umina Beach

Poor NBN FTTN/B design may lead to decades of congestion

“With a measly 2Gbps backhaul per node you can forget about 4K Netflix. FTTN is going to be no different to the current Telstra RIMs”

(analysis) Customers on the shiny new NBN FTTN and FTTB networks may find themselves left with slow and congested speeds for decades because of short-sighted network design decisions made by the company.

Analysis of the latest Network Design Rules for the NBN, dated 30th June 2015, reveals that customers may only be able to reach a committed information rate (CIR) of roughly 5Mbps on a fully loaded node – far short of the 25 mbps that popular internet streaming service Netflix says is required for 4K video streaming and also falls short of the Vertigan panel’s recommendation that 50% of Australians will only need 15 Mbps by 2023.

The calculation:

nbn™, the company responsible for building the NBN, currently deploys 4 Point-to-Point fibres from the Fibre Access Node (similar to an “exchange”) to the NBN node where the DSLAM equipment is located.  However, it also goes on to say that only 2 of the 4 fibres will be used for connectivity, with the other 2 reserved for “future growth or migration activities”.

NBN's Network Design Document explains 4 fibres will be allocated per NBN node with only 2 in service.
NBN’s Network Design Document explains 4 fibres will be allocated per NBN node with only 2 in service.

Each of the fibres will deliver a 1Gbps ethernet connection back to the NBN Access Aggregation Switch (AAS), totaling to an effective 2Gbps ethernet connection between the node and the Fibre Access Node – or 4Gbps if all 4 allocated fibres are used.

nbn™ introduces an Access Aggregation Switch (AAS) to combine traffic from multiple nodes to the POI

Also according to the document, depending on the DSLAM configuration, each of nbn™’s FTTN and FTTB nodes are capable of connecting up to 384 premises.

Table of NBN Copper DSLAM options

Taking all of the above into consideration, in a worse case scenario on a  fully-loaded node at peak hour, customers may only reach 5 Mbps if all traffic was distributed evenly:

Number of DSLAM ports Fibres used for uplink Entire node’s effective uplink (Mbps) Committed Information Rate (CIR, Mbps)
48 2 2000 41.7
192 2 2000 10.4
384 2 2000 5.2

Network design wreaks havoc for binge watching season

If a mere 21% of all premises connected to a node starts streaming a 4K stream on Netflix, the node will exceed its capacity.

As many saw with the launch of popular internet TV streaming service Netflix in Australia, telecommunications companies failed to predict the demand of the service leading to heavy network congestion across Australia’s major ISPs.

For some of Netflix’s popular productions like House of Cards and Orange is the New Black, the company releases all the episodes of in their series at once.  This results in a brand new network usage “profile” that Australian ISPs and network providers like NBN have seen little of before… where customers continuously watch (binge) and subsequently stream content for hours on end.

If a mere 21% of all premises connected to a node starts streaming a 4K stream on Netflix (21% of 384 at 25 Mbps), the node will exceed its capacity.  This will leave zero bandwidth for the remaining 75% of customers potentially connected to the node.

While it can be expected that NBN’s QoS (quality of service) management will balance the load to prevent a small number of customers hogging the entire link, all customers across the board will suffer from congestion issues because of it.

With the increasing prevalence of Internet TV in Australia, the limited design of the NBN FTTN and FTTB networks will have lasting implications on what Australians will be able to do with their Internet connection.


FTTP upgrade path, uncertain

nbn™ has also indicated that they will only deploy 12 fibres up to an NBN node, making it difficult to upgrade an NBN FTTN or FTTB node area to fibre without significant downtime or extensive civil works.

nbn™ is introducing the star topology for the MTM rollout to save money
nbn™ to rollout 12-core fibre to each node, rather than the existing 36 to save money

Assuming a fully loaded 384 port NBN node is to be upgraded from FTTN to FTTP, with 4 fibres already allocated to the FTTN DSLAM for connectivity back to the Fibre Access Node, 8 fibres are remaining to potentially deliver fibre services all the way to the customer’s premises.

However, the 8 fibres will only be capable of delivering GPON services (the FTTP technology that the NBN currently uses) to a maximum of 256 premises (each fibre can be split into 32 premises, 8 × 32 = 256).

Without causing massive disruption to all customers connected to the current node, it may not be possible to transition to FTTP on high-capacity nodes other than by rolling out the network from scratch again.

This means that even if nbn™ decides to upgrade the network, they will likely continue using copper-based technologies for the years ahead to avoid large capital costs again.

(edit) further reading: You can read nbn’s side of the story in their blog post here.