NBN Fibre to the Node Trial at Umina Beach

nbn’s right: users probably not affected by node congestion

nbn has strongly refuted suggestions that their node’s backhaul link is already hitting capacity, and figures seem to match their assertion.

(analysis) The company responsible for building the National Broadband Network, nbn, has refuted claims that backhaul congestion is the primary cause of slow speeds experienced by users on its recently-launched Fibre to the Node network. As a matter of distinction, this is separate from the blog post I wrote 7 months ago about long-term capacity challenges faced by nbn.  In this post, we are discussing congestion issues faced by current customers.

If we examine the figures closely, there simply isn’t enough customers on each node (yet) to need to worry about backhaul congestion yet.  In raw numbers, the lucky chaps in Belmont North connected to node 10 in Belmont 7 (2BLT-07-10) had just a smidgen under 100 premises connected at the start of this month.  This is followed closely by node 5 in Belmont 5 and node 2 in Belmont 1 in the raw take-up of high 80s.

Node (ADA) ID Node premises count Currently active premises
2BLT-07-10 233 93
2BLT-05-05 247 88
2BLT-01-02 226 84
2GRK-02-11 273 83
2BLT-10-08 246 82
2BLT-07-07 210 81
2BLT-07-17 233 80

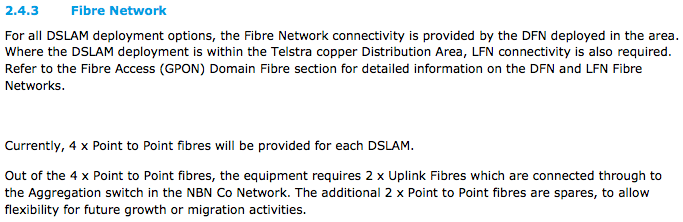
If we consider the FTTN AVC profile revealed in estimates (13% on 12/1 Mbps, 50% on 25/5 Mbps, 25% on 50/20 Mbps and 12% on 100/40 Mbps), we can consider an aggregate average downlink AVC of roughly 39 Mbps per FTTN user.  At roughly 100 per node sharing 1GE uplink fibre, even during full saturation — each user would get on average an uncontended 10 Mbps link.  That’s better than a 1:4 contention ratio — well above most, if not all, residential-grade services.

Of course, I’m not privy to NBN’s network utilisation graphs.  But I’m fairly confident that they will show in each node, there is currently plenty of buffer space.

As I’ve said in an earlier blog post, node-based congestion can really only be expected during peak times on a fully loaded node.  Without wider saturation of 4K TVs at this point in time, the entire neighborhood of 100 premises must stream at least 2 HD Netflix or YouTube video simultaneously before there starts to be congestion issues — a virtually impossible scenario.

We don’t know what may happen in the future. Perhaps when 4K becomes more mainstream, it will become an issue.  The scenario I posed was 25% of customers simultaneously streaming 4K is all it would take to congest a full loaded node.  But at least for now, it’s pretty safe to say that this particular factor is not major concern.

So if it’s not node backhaul, what is it?

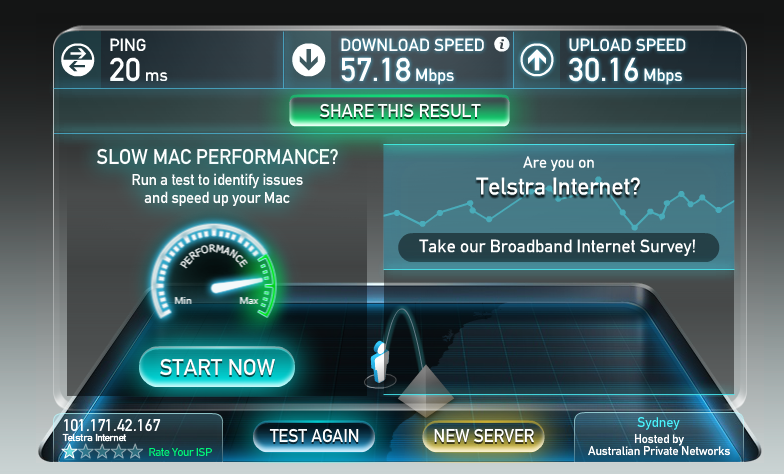
It must suck to be in this situation currently.  When you have end users posting speed tests well below 10 Mbps download “consistently”, you know there is an issue somewhere. Whether it’s a sync speed issue, CVC underprovisioning, packets being dropped by nbn somewhere within the network or something else altogether — testimony given by CEO Bill Morrow at the recent Senate Estimates suggests that nbn and service providers are working through it bit by bit to diagnose.  One thing’s for sure, it’s most probably nothing to do with node backhaul congestion yet.

Frequent travellers penalised under proposed Opal fare changes

Commuters travelling more than 10 journeys per week will pay on average $255 more per year.

In a classic pre-Christmas news dump, the Independent Pricing and Regulatory Tribunal (IPART) released its draft report into the review of public transport fares in Sydney and surrounds.

The review’s aims were clear — to remove the penalty commuters currently endure when switching between different modes of transport.  In doing so, the revenue will decline and to plug this revenue hole — a raft of changes about fare caps and rewards have been introduced.

After reading the “thrilling” 106 page report, what becomes immediately apparent after reading the report is that it’s not easy for your average Joe to compare fares and see how it may affect them.

So, knowing me, you’d probably guess that I’d build some fandangled app to do it… and I did: opalcompared.com.

The rest of this blog post will be split into two main sections, for different audiences:

  • a findings (based on some 12 thousand calculations done by visitors) section
  • a technology section (on how the app was built)

Findings

During the short time since the launch of Opal Compared, it had accumulated over 12,000 weekly journey calculations.  Through this, a few interesting trends had started to emerge:

(A small note: the statistics are based on a snapshot of around 12,000 Adult Opal fare calculations made on Opal Compared up till about 27th December 2015)

Travellers with over 10 journeys per week will have the highest fare increase

Probably summed up perfectly in this chart below, the more journeys you take on a weekly basis — the higher the average fare increase.  The less journeys you take, the more you save.


Source: Opal Compared (opalcompared.com)

The point where the average crosses over is at exactly the 10 journey mark.  Commuters who travel more than 10 journeys per week will on average pay $4.90 more per week (or $254.80 per year — if you budget on an annual basis).  Those who travel less will likely pocket a healthy discount of $3.49 per week on average.

This baffles me.  The proposed Opal fares seem counter-intuitive since the proposed fare changes will disincentivise people from using public transport.

It simply doesn’t make sense to reward those commuters who contribute the least to revenue.  Shouldn’t IPART be looking on setting fare structures that reward those commuters who travel the most, encouraging more people to use more public transport thus increasing revenue?

(more…)

Analysis: cross-bench and marginal seats benefit from 3 year NBN plan

Rollout numbers are higher in the densely populated areas held by cross-bench and marginal LNP MPs.

Writer’s note, 20th Oct: A point of clarification. While the data does show on an averaged party-margin basis that seats of a few cross-bench MPs have a higher number of homes in the 3 year plan, this does not suggest a direct correlation between the two. As stated previously in the article, albeit possibly not clearly enough, the seats held by the Greens, KAP and PUP are generally more densely populated and thus, would tend to have higher rollout figures in the fixed-line 3 year plan.

Analysis of the nbn construction plan released last week shows that on an averaged per-electorate basis, seats held by cross-bench MPs Adam Bandt (Greens), Bob Katter (Katter Australian Party), Clive Palmer (Palmer United Party) and conservative LNP seats has the greatest number of premises scheduled to commence construction over the next 3 years. However, the majority of these seats are coincidentally located in the more densely populated areas of Australia.

By party margin on a per-electorate basis

Between now and September 2018, Adam Bandt’s electorate of Melbourne is expected to see 99,600 premises commence build.  Bob Katter’s electorate of Kennedy is expected to see 71,500 premises commence build, followed by Clive Palmer’s electorate of Fairfax taking 68,200 premises into build by late 2018.

On a per-electorate basis (that is, the total number of premises divided by the number of seats held), marginal Liberal-National Party and Nationals Party seats come in at fourth and fifth with 59,233 and 56,300 premises expected to enter build respectively.

Party Margin classification Total planned fixed-line Electorates under this category Planned Fixed-line (per-electorate)*
GRN Cross bench  99,600 1  99,600
KAP Cross bench  71,500 1  71,500
PUP Cross bench  68,200 1  68,200
LNP Marginal  355,400 6  59,233
NAT Marginal  56,300 1  56,300
ALP Safe  836,200 15  55,747
LIB Fairly safe  493,500 9  54,833
LIB Safe  1,430,800 29  49,338
ALP Marginal  1,413,400 29  48,738
NAT Fairly safe  48,600 1  48,600
NAT Safe  331,500 7  47,357
LNP Safe  323,200 7  46,171
LNP Fairly safe  406,200 9  45,133
ALP Fairly safe  472,500 11  42,955
LIB Marginal  819,500 20  40,975
IND Cross bench  60,500 2  30,250

* the total number of premises in the plan to commence build (column 3), divided by the number of seats held within the party-margin category (column 4)

Graph showing planned premises in the 3 year rollout plan sorted by electorate margin, normalised by dividing the number of premises by the number of seats held
Graph showing planned premises in the 3 year rollout plan sorted by seat margin, normalised by dividing the number of premises by the number of seats held in each category

By electorate

However, the winning electorate is the electorate of Sydney – currently held by Labor MP Tanya Plibersek – with a total of 106,800 premises slated to commence build by late 2018.  This is followed closely by Adam Bandt’s seat of Melbourne (99,600), Labor MP Melissa Parke’s marginal seat of Fremantle (94,700) and Labor MP Clare O’Neil’s seat of Hothan (92,000).  The high number of premises in these areas is reflective of the dense population of these inner metropolitan centres.

Of the 150 federal electorates, only the electorate of Solomon – held by Country Liberal MP Natasha Griggs – has no fixed-line rollout plans.  The electorate covers the greater Darwin area where NBN rollout is mostly completed or already underway.

Electorate Name MP elected in 2013 Held by Margin classification Planned FTTx Premises Planned HFC premises Planned Fixed Line (total)
Sydney Tanya Plibersek ALP Safe 12,100 94,700 106,800
Melbourne Adam Bandt GRN Cross bench 24,800 74,800 99,600
Fremantle Melissa Parke ALP Marginal 89,500 5,200 94,700
Hotham Clare O’Neil ALP Fairly safe 6,000 86,000 92,000
Flinders Greg Hunt LIB Safe 90,900 0 90,900
Higgins Kelly O’Dwyer LIB Fairly safe 0 90,000 90,000
Bruce Alan Griffin ALP Marginal 29,500 54,600 84,100
Wakefield Nick Champion ALP Marginal 55,100 28,900 84,000
Leichhardt Warren Entsch LNP Marginal 63,500 19,600 83,100
Chisholm Anna Burke ALP Marginal 700 80,600 81,300
Moncrieff Steven Ciobo LNP Safe 17,600 63,600 81,200
Warringah Tony Abbott LIB Safe 18,000 60,000 78,000
Kooyong Josh Frydenberg LIB Safe 0 75,600 75,600
Batman David Feeney ALP Safe 1,700 73,200 74,900
Blaxland Jason Clare ALP Safe 4,300 69,900 74,200
Kingsford Smith Matt Thistlethwaite ALP Marginal 1,600 72,400 74,000
Corio Richard Marles ALP Fairly safe 72,800 0 72,800
Kennedy Bob Katter KAP Cross bench 59,100 12,400 71,500
Fairfax Clive Palmer PUP Cross bench 68,200 0 68,200
Stirling Michael Keenan LIB Safe 59,800 7,800 67,600
Deakin Michael Sukkar LIB Marginal 2,500 63,800 66,300
Cowan Luke Simpkins LIB Fairly safe 43,000 22,200 65,200
Adelaide Kate Ellis ALP Marginal 17,700 47,000 64,700
Jagajaga Jenny Macklin ALP Marginal 8,500 55,500 64,000
Forrest Nola Marino LIB Safe 63,500 0 63,500
Corangamite Sarah Henderson LIB Marginal 63,400 0 63,400
North Sydney Joe Hockey LIB Safe 7,900 55,500 63,400
Boothby Andrew Southcott LIB Fairly safe 25,600 37,000 62,600
Bendigo Lisa Chesters ALP Marginal 61,900 0 61,900
Lalor Joanne Ryan ALP Safe 32,500 29,300 61,800
Fraser Andrew Leigh ALP Safe 48,400 13,400 61,800
McEwen Rob Mitchell ALP Marginal 61,500 0 61,500
Bowman Andrew Laming LNP Fairly safe 36,100 25,000 61,100
Dunkley Bruce Billson LIB Marginal 36,100 24,100 60,200
Port Adelaide Mark Butler ALP Safe 51,600 8,200 59,800
Greenway Michelle Rowland ALP Marginal 23,300 36,000 59,300
Bradfield Paul Fletcher LIB Safe 0 58,900 58,900
Petrie Luke Howarth LNP Marginal 17,200 41,600 58,800
Gellibrand Tim Watts ALP Safe 14,100 44,700 58,800
Gorton Brendan O’Connor ALP Safe 24,900 33,400 58,300
Chifley Ed Husic ALP Safe 9,000 49,000 58,000
Isaacs Mark Dreyfus ALP Marginal 21,300 36,400 57,700
Fisher Mal Brough LNP Fairly safe 57,600 0 57,600
La Trobe Jason Wood LIB Marginal 43,500 13,900 57,400
Mitchell Alex Hawke LIB Safe 26,800 30,000 56,800
Gippsland Darren Chester NAT Safe 56,400 0 56,400
Page Kevin Hogan NAT Marginal 56,300 0 56,300
Richmond Justine Elliot ALP Marginal 55,900 0 55,900
Canning Don Randall LIB Safe 55,800 0 55,800
Farrer Sussan Ley LIB Safe 55,700 0 55,700
Gilmore Ann Sudmalis LIB Marginal 55,200 0 55,200
Tangney Dennis Jensen LIB Safe 44,100 11,100 55,200
Paterson Bob Baldwin LIB Fairly safe 55,100 0 55,100
Bonner Ross Vasta LNP Marginal 8,400 46,600 55,000
Capricornia Michelle Landry LNP Marginal 54,800 0 54,800
Forde Bert van Manen LNP Marginal 28,800 25,800 54,600
Barton Nickolas Varvaris LIB Marginal 1,700 52,800 54,500
Cook Scott Morrison LIB Safe 5,900 48,200 54,100
Dickson Peter Dutton LNP Fairly safe 20,200 33,500 53,700
New England Barnaby Joyce NAT Safe 39,800 13,900 53,700
Calare John Cobb NAT Safe 53,500 0 53,500
Moreton Graham Perrett ALP Marginal 5,000 47,600 52,600
Throsby Stephen Jones ALP Fairly safe 52,500 0 52,500
O’Connor Rick Wilson LIB Marginal 52,300 0 52,300
Barker Tony Pasin LIB Safe 51,700 0 51,700
Riverina Michael McCormack NAT Safe 51,600 0 51,600
Sturt Christopher Pyne LIB Safe 18,800 32,200 51,000
Hunter Joel Fitzgibbon ALP Marginal 50,800 0 50,800
Hume Angus Taylor LIB Safe 49,000 1,600 50,600
Mayo Jamie Briggs LIB Safe 45,900 4,700 50,600
Dawson George Christensen LNP Fairly safe 50,300 0 50,300
Kingston Amanda Rishworth ALP Fairly safe 47,100 3,100 50,200
Indi Cathy McGowan IND Cross bench 50,100 0 50,100
Wills Kelvin Thomson ALP Safe 6,100 43,700 49,800
Durack Melissa Price LIB Marginal 49,500 0 49,500
Brisbane Teresa Gambaro LNP Marginal 4,000 45,100 49,100
Fadden Stuart Robert LNP Safe 23,100 26,000 49,100
Grey Rowan Ramsey LIB Safe 48,900 0 48,900
Reid Craig Laundy LIB Marginal 12,800 36,000 48,800
Mallee Andrew Broad NAT Fairly safe 48,600 0 48,600
Pearce Christian Porter LIB Fairly safe 43,000 5,400 48,400
Bennelong John Alexander LIB Fairly safe 2,600 44,800 47,400
Aston Alan Tudge LIB Fairly safe 2,200 44,800 47,000
Ryan Jane Prentice LNP Fairly safe 13,000 34,000 47,000
McMillan Russell Broadbent LIB Safe 46,900 0 46,900
Grayndler Anthony Albanese ALP Safe 1,200 45,400 46,600
Eden-Monaro Peter Hendy LIB Marginal 46,500 0 46,500
Flynn Ken O’Dowd LNP Fairly safe 45,300 0 45,300
Wannon Dan Tehan LIB Safe 45,300 0 45,300
Perth Alannah MacTiernan ALP Marginal 45,200 0 45,200
Oxley Bernie Ripoll ALP Marginal 23,800 21,300 45,100
Shortland Jill Hall ALP Fairly safe 44,900 0 44,900
Lyne David Gillespie NAT Safe 44,600 0 44,600
Brand Gary Gray ALP Marginal 44,600 0 44,600
Makin Tony Zappia ALP Marginal 28,600 15,900 44,500
Calwell Maria Vamvakinou ALP Safe 29,800 14,300 44,100
Hinkler Keith Pitt LNP Fairly safe 43,500 0 43,500
McPherson Karen Andrews LNP Safe 12,600 30,600 43,200
Parkes Mark Coulton NAT Safe 43,200 0 43,200
Newcastle Sharon Claydon ALP Fairly safe 43,200 0 43,200
Maranoa Bruce Scott LNP Safe 42,100 0 42,100
Casey Tony Smith LIB Fairly safe 25,400 16,600 42,000
Braddon Brett Whiteley LIB Marginal 39,900 0 39,900
Wentworth Malcolm Turnbull LIB Safe 0 39,600 39,600
Banks David Coleman LIB Marginal 1,100 38,300 39,400
Curtin Julie Bishop LIB Safe 1,500 37,100 38,600
Holt Anthony Byrne ALP Fairly safe 19,200 19,300 38,500
Rankin Jim Chalmers ALP Marginal 4,700 33,100 37,800
McMahon Chris Bowen ALP Marginal 8,000 29,200 37,200
Wide Bay Warren Truss LNP Safe 36,500 0 36,500
Groom Ian Macfarlane LNP Safe 35,900 0 35,900
Swan Steve Irons LIB Fairly safe 33,300 2,500 35,800
Canberra Gai Brodtmann ALP Fairly safe 35,400 0 35,400
Macarthur Russell Matheson LIB Safe 35,200 0 35,200
Wright Scott Buchholz LNP Safe 35,200 0 35,200
Hasluck Ken Wyatt LIB Marginal 34,700 0 34,700
Murray Sharman Stone LIB Safe 34,700 0 34,700
Moore Ian Goodenough LIB Safe 9,900 24,600 34,500
Goldstein Andrew Robb LIB Safe 0 34,300 34,300
Blair Shayne Neumann ALP Marginal 14,400 18,400 32,800
Hindmarsh Matt Williams LIB Marginal 6,100 24,100 30,200
Griffith Kevin Rudd ALP Marginal 7,400 22,800 30,200
Maribyrnong Bill Shorten ALP Safe 1,600 28,200 29,800
Lilley Wayne Swan ALP Marginal 3,600 25,800 29,400
Cowper Luke Hartsuyker NAT Safe 28,500 0 28,500
Robertson Lucy Wicks LIB Marginal 28,400 0 28,400
Mackellar Bronwyn Bishop LIB Safe 12,100 15,800 27,900
Melbourne Ports Michael Danby ALP Marginal 3,700 24,000 27,700
Scullin Andrew Giles ALP Safe 12,900 14,800 27,700
Macquarie Louise Markus LIB Marginal 27,000 0 27,000
Lyons Eric Hutchinson LIB Marginal 26,900 0 26,900
Lindsay Fiona Scott LIB Marginal 5,100 21,500 26,600
Ballarat Catherine King ALP Marginal 25,200 0 25,200
Hughes Craig Kelly LIB Safe 5,000 19,900 24,900
Herbert Ewen Jones LNP Fairly safe 24,600 0 24,600
Werriwa Laurie Ferguson ALP Marginal 8,300 15,900 24,200
Berowra Philip Ruddock LIB Safe 7,200 16,600 23,800
Fowler Chris Hayes ALP Safe 9,800 14,000 23,800
Longman Wyatt Roy LNP Fairly safe 23,100 0 23,100
Cunningham Sharon Bird ALP Fairly safe 20,900 0 20,900
Parramatta Julie Owens ALP Marginal 3,600 13,300 16,900
Menzies Kevin Andrews LIB Safe 0 16,800 16,800
Franklin Julie Collins ALP Marginal 14,800 0 14,800
Charlton Pat Conroy ALP Fairly safe 12,900 0 12,900
Lingiari Warren Snowdon ALP Marginal 11,300 0 11,300
Denison Andrew Wilkie IND Cross bench 10,400 0 10,400
Watson Tony Burke ALP Fairly safe 3,500 5,700 9,200
Dobell Karen McNamara LIB Marginal 8,300 0 8,300
Bass Andrew Nikolic LIB Marginal 4,000 0 4,000
Solomon Natasha Griggs CLP Marginal 0 0 0

Mobile Broadband is fast becoming the new printer industry

Dirt-cheap printers, sky-high ink costs. Australia’s prepaid mobile broadband market is replicating the printer industry’s business model.

When you compare monthly mobile broadband plans with the starter kits you can get at your local supermarket or technology store, you would find an unfortunate truth.  Starter kits, often including a Wi-Fi 3G modem, are comparatively cheaper than your monthly access cost.

Last month, I saw an excellent deal.  I bought two Vodafone 3G Pocket Wi-Fi + 3GB SIM (with a bonus 8GB SIM with 90 day expiry) for a mere $38 from Harvey Norman.  That’s 22GB over a total of 240 days.

Compare that with the closest prepaid plan in terms of cost: the $40 Vodafone Mobile Broadband recharge — which will only give me 4.5GB over 40 days.

The 22GB offer Vodafone currently provides online is $200, albeit with an expiry of 365 days.  That’s a whopping 5x more expensive!

Invoice summary showing my Vodafone 3G Modem + data purchase. 22GB for $38!
Purchase option Total data Expiry Total cost Cost per GB
2 × Vodafone 3G Pocket Wi-Fi + 3GB (+ bonus 8GB) 22 GB 240 days $38 $1.73
1 × Vodafone $40 MBB Recharge 4.5 GB 40 days $40 $8.88
1 × Vodafone $200 MBB Recharge 22 GB 365 days $200 $9.09

We haven’t even accounted for the cost of the Wi-Fi modem that comes with the starter pack.  A Huawei-made Vodafone Pocket WiFi R207.

Original packaging of the Vodafone Pocket WiFi 3G

This is perhaps one of the most extreme cost differential examples — however, this same phenomenon is replicated across all major carriers.  Telstra and Optus both have the same tactic of selling mobile broadband dongles for below-cost and bundled with a generous one-off data bonus.  Sounds awfully like a printer company, am I right?

What’s the catch?

The business model that the major carriers are using promotes the mass purchase of SIM cards and mobile broadband devices.  What’s the problem?

Firstly, Australia is fast running out of mobile phone numbers with the ACMA projecting phone numbers will be exhausted in 2017.  If each person in Australia simply buys new SIM cards with new phone numbers to take advantage of these deals, the depletion of mobile phone numbers further accelerate.  Luckily, the 05xx number range has been reserved for future expansion — nonetheless, getting new numbers for each new SIM purchased is unsustainable.

Secondly, it’s an account management nightmare.  Each new SIM would need a new account login on the mobile carrier’s website to check and keep track of data usage.  It would be a pain to have to change this every month.  Also, Australian’s are expected to declare how many phone services they have active under their name — this could be massive if we end up buying new SIMs every month.

Lastly, we have the same environmental issues as printers — we’ll end up with far more mobile Wi-Fi modems that we’d possibly need.  Personally, I’m currently in posession of 5 mobile broadband modems while I’ve been taking advantage of these deals — three Telstra modems and two Vodafones.  Most of these — I don’t use and to be honest, I’d be happy to give away.  It just goes to show how much waste there is in electronics these days.

And the printer…

Yes. I also bought a printer. Harvey Norman was also selling a multi-function inkjet printer for $17 that I couldn’t resist but buy.

Harvey Norman selling the HP Officejet 2620 All In One Printer for $17

The printer even has clicky buttons, an LCD screen, fax functionality and a document-feeder scanner.

I’m yet to use any of its ink, I bought it purely for its document-feeder scanner to move towards a paper-less environment.  I think I have broken their business model.

Could we have gone all fibre rather than this G.Fast talk?

Did we miss an opportunity to get an FTTP+HFC rollout? Figures from NBN’s stragegic review suggest a two-stage FTTN to G.Fast upgrade could now cost more than if we just stuck with FTTP

Even before they’ve switched on a single Fibre to the Node customer — nbn, the company responsible for building the National Broadband Network, has been busy spruiking their plans to trial and eventually upgrade Fibre to the Node to G.Fast technology to the media.

However, acccording to estimates made in the company’s Strategic Review, building the Fibre to the Node network now and upgrading to Fibre to the Distribution Point (FTTdp) using G.Fast technology would have saved a mere $2 billion dollars compared with a “radically redesigned” Fibre to the Premises rollout.  Since then, blowouts in the Fibre to the Node rollout would have surpassed the said savings of $2 billion dollars.

Fibre to the Node: blowouts

The company had straight-out refused to publish a raw Fibre to the Node cost-per-premises figure in their Strategic Review. However, on page 101 of the Strategic Review, the company estimated that it will cost around $2 billion dollars to roll out 3.6 million premises using Fibre to the Node architecture.  This equates to approximately $555 — $833 per premises (assuming range of $2 — $3 billion dollars divided by 3.6 million premises).

The FTTdp upgrade cost breakdown in the Strategic Review

According to the latest 2016 corporate plan, this cost has blown out to $1,600 per premises or a net increase of $767 — $1,045 per premises (excluding infrastructure lease which was not attributed to CPP in original calculations).

Current cost-per-premises projections as stated NBN's 2016 corporate plan
Current cost-per-premises projections as stated NBN’s 2016 corporate plan

nbn has also increased the FTTN/B/dp footprint from 3.6 million premises to 4.5 million.  From Fibre to the Node cost per premises alone, this has attributed to a net blowout of between $3.5 to $4.7 billion dollars from Strategic Review cost estimates — potentially overriding the savings of $2 billion envisaged in the VDSL–G.Fast upgrade path.

Fibre to the Premises: better than expected?

The issue with this is of course, comparing FTTN costs with costs that we’d never know.  We will never know exactly how much a “radically redesigned” FTTP rollout would have costed — but we can make estimates:

Comparing NBN’s estimates for Fibre to the Premises (Revised Outlook) in the Strategic Review with current Fibre to the Premises, figures shows they had over-estimated the capital expenditure of the FTTP rollout by about 11%: ~$4,100 in the Strategic Review ($1,997 for LNDN plus $2,100 for the activation, equating to $4,097 — see pages 62 and 64 of SR) vs $3,700 in the 2016 Corporate Plan.  This suggests better-than-expected costs in the Fibre to the Premises rollout costs.

But it’s too late anyway

But unfortunately, the company has already invested billions into developing the so-called Multi-Technology Mix and has a task to rollout Fibre to the Node thanks much to Government policy.  These are costs that taxpayers will never be able to recover, meaning we may have missed another opportunity to rollout FTTP in the majority of the now-FTTN footprint.

As the cost of the copper-based network increases, the comparative investment in those technologies become less attractive.  Speed and capacity upgrades require installing more active equipment in the field and also extending fibre closer to the home. Thus, incremental upgrades and ongoing operating expenses on a copper-based broadband network is far greater than those on a fibre-based network where only tail equipment has to be swapped out.

If the savings in building a copper-based network are relatively small in initial capital expenditure — eventually, the economics will reverse and bite back.

Since Fibre to the Node will now span the majority of the network, the only logical upgrade path for those areas would now be FTTdp because of all the capital costs sunken into rolling out FTTN.  But don’t think for a second that it will be actually cheaper than rolling out fibre all the way to the home in the first place.


In summary, if the Strategic Review’s figures are to be trusted, we may have missed yet another opportunity to get a FTTP network, albeit “radically redesigned” in nbn‘s vernacular.  Calculations suggest it could have cost less than what the current FTTN rollout plus a G.Fast upgrade in 2020 will cost.  Plus, the company has also proved at almost every instant that they had underestimated any non-FTTP costs in the strategic review and helpfully inflated any FTTP costs higher than actuals.

What are your thoughts?  The analysis, of course, makes assumptions based on the available data.  I think it’s a real pity how it seems time after time, taxpayer’s money ends up being wasted based on a false premise in a rushed report.

Opinion: iiDallas ruling may fix systemic piracy problem

Surprise ruling on online copyright infringement case may help Aussie consumers with pricing and availability of content in the long run.

In a surprise ruling of handed down by Justice Perram last week, Dallas Buyers Club LLC was denied access to the details of around 5,000 iiNet customers who are alleged to have pirated the movie using peer-to-peer technology — after the judge deemed that some damages that DBC wanted to claim from alleged infringers were “untenable”.

In summary, the judge determined that Dallas Buyers Club could only reclaim the cost of the film if it had been genuinely downloaded plus a proportion of the legal costs.  Perram described other claims sought by DBC as being “untenable”, denying the company from seeking:

  • A claim for an amount based on each person who had accessed the uploaded film from each downloader’s Torrent source; and
  • A claim for punitive damages depending on how many copies of other non-DBC copyrighted works had been downloaded by each infringer

Effectively, the ruling sets a precedent against so-called speculative invoicing in Australia where rights holders hold alleged pirates at ransom by demanding large sums (often in the thousands of dollars) or risk facing legal action.

Ruling will prompt rights holders to “do the right thing”

Unlike in other countries where speculative invoicing can be seen as a large source of income for rights holders, Perram’s ruling last week removes much of the financial benefit for rights holders to pursuit alleged pirates.  Legal action will only enable rights holders to recover costs of a regular sale of the film to infringers — and no more.

In effect, this would encourage rights holders to boost availability and affordability of its own content in Australia rather than risking the expensive and unpredictable process of legal proceedings to reclaim costs later down the road.  (Believe it or not, earning money straight away is probably better than not selling something, then suing something for stealing it, and then not knowing the outcome of those proceedings.)

Ruling “a big win” to Australian consumers in more ways than one

Not only is ransom speculative invoicing effectively “banned” by the ruling, it may in fact reduce piracy in the long run.

Traditionally, the island nation of Australia has always suffered from timely and affordable releases — especially TV shows or movies.  But the age of the Internet has changed everything and Australian consumers are able to jump the hurdles to access content intended for overseas or otherwise, pirated.

In June, I did an analysis on the most pirated movies in that month — and found that 67% of those movies were not available for legal digital purchase.  Just imagine if those movies were available for legal purchase!

Australians have long shown that they are willing to pay for content that is easily accessible and are at an affordable price.  The rapid uptake of paid, subscription services such as Netflix, Presto and Stan is evidence of this.

If rights holders continue their current trend of holding back digital releases in select countries, they may find themselves at a financially risky position of recouping limited sales costs.  They also risk the process backfiring on them, leaving them surplus legal costs and no net revenue gain.

So… perhaps now that legal action is shaping up to be not too attractive, rights holders will finally work together to and resolve complex geography-based licensing restrictions and restrictive DRM models to provide us as consumers “easy ways” to purchase content legitimately and legally.  One can dream.

Inside an NBN node at Umina Beach

Poor NBN FTTN/B design may lead to decades of congestion

“With a measly 2Gbps backhaul per node you can forget about 4K Netflix. FTTN is going to be no different to the current Telstra RIMs”

(analysis) Customers on the shiny new NBN FTTN and FTTB networks may find themselves left with slow and congested speeds for decades because of short-sighted network design decisions made by the company.

Analysis of the latest Network Design Rules for the NBN, dated 30th June 2015, reveals that customers may only be able to reach a committed information rate (CIR) of roughly 5Mbps on a fully loaded node – far short of the 25 mbps that popular internet streaming service Netflix says is required for 4K video streaming and also falls short of the Vertigan panel’s recommendation that 50% of Australians will only need 15 Mbps by 2023.

The calculation:

nbn™, the company responsible for building the NBN, currently deploys 4 Point-to-Point fibres from the Fibre Access Node (similar to an “exchange”) to the NBN node where the DSLAM equipment is located.  However, it also goes on to say that only 2 of the 4 fibres will be used for connectivity, with the other 2 reserved for “future growth or migration activities”.

NBN's Network Design Document explains 4 fibres will be allocated per NBN node with only 2 in service.
NBN’s Network Design Document explains 4 fibres will be allocated per NBN node with only 2 in service.

Each of the fibres will deliver a 1Gbps ethernet connection back to the NBN Access Aggregation Switch (AAS), totaling to an effective 2Gbps ethernet connection between the node and the Fibre Access Node – or 4Gbps if all 4 allocated fibres are used.

nbn™ introduces an Access Aggregation Switch (AAS) to combine traffic from multiple nodes to the POI

Also according to the document, depending on the DSLAM configuration, each of nbn™’s FTTN and FTTB nodes are capable of connecting up to 384 premises.

Table of NBN Copper DSLAM options

Taking all of the above into consideration, in a worse case scenario on a  fully-loaded node at peak hour, customers may only reach 5 Mbps if all traffic was distributed evenly:

Number of DSLAM ports Fibres used for uplink Entire node’s effective uplink (Mbps) Committed Information Rate (CIR, Mbps)
48 2 2000 41.7
192 2 2000 10.4
384 2 2000 5.2

Network design wreaks havoc for binge watching season

If a mere 21% of all premises connected to a node starts streaming a 4K stream on Netflix, the node will exceed its capacity.

As many saw with the launch of popular internet TV streaming service Netflix in Australia, telecommunications companies failed to predict the demand of the service leading to heavy network congestion across Australia’s major ISPs.

For some of Netflix’s popular productions like House of Cards and Orange is the New Black, the company releases all the episodes of in their series at once.  This results in a brand new network usage “profile” that Australian ISPs and network providers like NBN have seen little of before… where customers continuously watch (binge) and subsequently stream content for hours on end.

If a mere 21% of all premises connected to a node starts streaming a 4K stream on Netflix (21% of 384 at 25 Mbps), the node will exceed its capacity.  This will leave zero bandwidth for the remaining 75% of customers potentially connected to the node.

While it can be expected that NBN’s QoS (quality of service) management will balance the load to prevent a small number of customers hogging the entire link, all customers across the board will suffer from congestion issues because of it.

With the increasing prevalence of Internet TV in Australia, the limited design of the NBN FTTN and FTTB networks will have lasting implications on what Australians will be able to do with their Internet connection.


FTTP upgrade path, uncertain

nbn™ has also indicated that they will only deploy 12 fibres up to an NBN node, making it difficult to upgrade an NBN FTTN or FTTB node area to fibre without significant downtime or extensive civil works.

nbn™ is introducing the star topology for the MTM rollout to save money
nbn™ to rollout 12-core fibre to each node, rather than the existing 36 to save money

Assuming a fully loaded 384 port NBN node is to be upgraded from FTTN to FTTP, with 4 fibres already allocated to the FTTN DSLAM for connectivity back to the Fibre Access Node, 8 fibres are remaining to potentially deliver fibre services all the way to the customer’s premises.

However, the 8 fibres will only be capable of delivering GPON services (the FTTP technology that the NBN currently uses) to a maximum of 256 premises (each fibre can be split into 32 premises, 8 × 32 = 256).

Without causing massive disruption to all customers connected to the current node, it may not be possible to transition to FTTP on high-capacity nodes other than by rolling out the network from scratch again.

This means that even if nbn™ decides to upgrade the network, they will likely continue using copper-based technologies for the years ahead to avoid large capital costs again.

(edit) further reading: You can read nbn’s side of the story in their blog post here.

Telstra’s network rules rural Australia

Telstra’s 3G/4G outperforms Optus along NSW’s regional railway route.

Regional train trips used to be occupied by staring out into the vast NSW country side and marveling at the single-rail track first built over a century before.  But in this day and age, I try to make good use of the 6 hours I spend on the XPT between Sydney and Taree.  After spending a solid week and plus a train ride with the trusty Telstra 4G USB+Wi-Fi Plus dongle and my OnePlus One with a Vaya Mobile sim card running on the Optus network last week, I thought I’d share a few thoughts about my experience on both the Telstra and Optus network.

Inside the Telstra 4G USB+Wi-Fi Plus box: the dongle itself along with some documentation

The train trip

Perhaps unsurprisingly, both Optus and Telstra have solid 4G coverage in metropolitan Sydney.  In the first half hour as I travelled north through Central, Strathfield, Epping and Hornsby, both networks allowed me to do basic work – access my Google Documents and some development work without issues.  But as the train journeyed past Hornsby, towards the Central Coast – the networks began to differentiate themselves.

Optus’ signal began to drop in and out frequently, while for the most part, the network connection on the Telstra network was relatively stable.  My phone struggled to get reception until we approached built-up areas along the Central Coast and Newcastle stretch, often defaulting to “Emergency Phone Calls Only”.

Meanwhile, on the Telstra network, things continue to run smoothly.  I even received an SMS saying I was passing one of Telstra’s new “4G only areas” where there is data only, and no voice services.

Passing through one of Telstra's new 4G-only areas
Passing through one of Telstra’s new 4G-only areas
Map showing (roughly) parts of TrainLink's North Coast Line (orange).
Map showing (roughly) parts of TrainLink’s North Coast Line (orange).

However, once we passed Maitland and headed north-west towards Dungog, both network started to struggle.  To put some of this into context, for those unfamiliar with the train journey from Sydney to Taree, the train travels inland a fair bit.  It’s no surprise that coverage struggled in some of these areas – not only was there very low population density in some of these areas… but the train tracks were often installed in trenches that were dug out of the rocky and hilly terrain.  For a lot of the journey, we would have been below the line of sight of most towers even if there were any.

However, I was not dismayed – I continued my experiment!  I found that the Telstra dongle managed to pick up the occasional 3G and even 4G signal as we approached nearby towns or passed a tall mountain in the distance with a reception tower… while the Optus phone: well, let’s just say there wasn’t much to report on.  Even as the train was approaching the major settlements of Wingham and Taree, my Optus phone got a bar of “E” at best – just enough to send an SMS.  I suspect the trees and foliage had a major factor in dampening the Optus network signals which has relatively lower transmission signal compared with Telstra’s NextG.

But the pleasant surprise awaited me at the station…

4G in Taree, 4GX in Forster-Tuncurry!

Unlike Optus who still hasn’t upgraded their mobile networks around Taree, Telstra has 4G coverage in the majority of the built-up area around Taree.  Their 4G coverage even extended further east than what their coverage website indicates.  Whereas I’d sometimes struggle to load my emails or even load Google News on my Optus phone in surrounding towns of Taree, I found that I was able to consistently load pages without an issue.  It was really nice to see!

Telstra's coverage map around Taree.  From my experience, 4G coverage extended out to Cundletown (where the pin is)
Telstra’s coverage map around Taree. From my experience, 4G coverage extended out to Cundletown (where the pin is)

The neighbouring towns of Forster and Tuncurry were fortunate enough to have received the 4GX upgrade, and so as you can imagine – a speed test was in order:

Solid speeds of 57/30Mbps over Telstra 4GX in Forster, NSW

Conclusion

Overall, I’m thoroughly impressed with Telstra’s coverage and network speed in and around Taree.  If I still lived there, I would be seriously contemplating a switch from Optus to Telstra’s network right about now.  It’s something I’m going to consider when I finally decide to get a new phone, for the convenience when I’m back home.

While both Optus and Telstra’s network struggled in parts of the train trip from Sydney to Taree, Telstra’s network was clearly in front in terms of coverage.  It had solid coverage between the Central to Newcastle segment, and an admirable effort in the really sparsely populated areas between the settlements of Maitland, Dungog, Gloucester and Wingham.  But where I thought Telstra’s network really shone was the coverage as we approached rural towns.  Approaching Wingham and Taree, Telstra’s network “just worked” while Optus’ required quite a bit of arm flailing even to get “one bar” of 2G signal.

Optus still has a fair bit to catch up in regional Australia – and with no successful bids in the first iteration of the Federal Government’s Regional Blackspots Program, I see that it will be hard for them to catch up with Telstra.

As for Vodafone?  I didn’t get to test them this time around, but I’m definitely planning a future comparison between Telstra and Vodafone for my next train trip.

Also, a review of the Telstra 4G USB+Wi-Fi Plus dongle is coming soon 🙂


Note: I am part of Telstra’s Influentials Program. The Telstra 4G USB+Wi-Fi Plus dongle was provided by Telstra, however, it is important to note that Telstra has no control over my editorial content. The experience above is based on my personal experience using the following devices for the respective networks:

  • Telstra 3G/4G/4GX: Telstra 4G USB+Wi-Fi Plus, using Wi-Fi to my laptop
  • Optus 3G/4G: OnePlus One, tethering from my phone to my laptop


Fibre rollout may be one-third less than Strategic Review

(analysis) NBN Co may rollout as little as 16% fibre to the premises under new principles released by the company. Their new guidelines reveal that within the fixed-line footprint, only new developments with over 100 premises or areas where fibre rollout are in advanced stages will likely receive Fibre to the Premises (FTTP). Remaining premises will be served by a mix of HFC and Fibre to the Node or Basement in the fixed-line footprint. This is despite the NBN Co Strategic Review initiated by the incoming Coalition government released 11 months ago suggested that at least 24% of premises in Australia will get FTTP.

Calculations conducted using myNBN.info’s extensive statistics reveal that only around 70 Fixed-line Service Areas (comparable to cities, see tables below) around the whole of Australia are “completed” or “in advanced stages” of the rollout (at least 50% of the rollout modules have at least begun build preparation). This accounts for roughly 1 million premises, or 8% at the end of the rollout in 2020. In addition, NBN Co expects another approximately 1 million premises in new developments (known as greenfields areas) with over 100 premises, accounting for a further 8%1. The total of 16% is roughly one third less than the original 24% suggested in the Strategic Review, or approximately 1 million premises around Australia.

The Government’s statement of expectations mandates the company to provide at least 25 mbps download speeds to all Australian premises with at least 90% of premises in the fixed-line footprint able to get 50 mbps or faster download speeds. NBN Co will only consider installing fibre in areas, not individual premises, where NBN Co finds the existing copper infrastructure to be incapable of delivering speeds required by the mandate. NBN Co is also investigating the possibility for installing fibre in limited “high-profit” areas as well as providing an end-user co-funded “fibre on demand” model.

The figure for greenfields fibre rollout may decrease further as the Government considers new rules that encourage property developers to use alternative fibre providers such as Opticomm.

In previous testimony, NBN Co’s CEO Bill Morrow had indicated that the Fibre to the Premises rollout mix may in fact be higher than that modelled in the Strategic Review:

Bill Morrow: In fact, the number that I recall is a bit higher than that in the early stage of the modelling that we are working on right now.

However, it appears that the modelling has reversed in terms of the number of FTTP premises. In less than 11 months, the multi-technology modelling conducted by NBN Co in their strategic review appears to have been proven to be inaccurate.

(more…)

Inside an NBN node at Umina Beach

Anti-cherry picking limiting consumers in FTTN

Whether you like it or not, NBN Co’s business case benefits from the so called “anti-cherry picking” laws — or Telecommuncations Act 1997, Sect 141B to be exact. It basically gives monopoly provisions for NBN Co to build a “superfast carriage service” (basically an internet connection able to normally deliver 25Mbps or greater speeds) without competition from other carriers. This gives NBN Co the ability to cross-subsidise and create uniform pricing across Australia.

The fundamental problem with Section 141B in this new MTM network architecture being undertaken by the new NBN management is that consumers no longer have a choice of speeds. Australians covered by the FTTN/dp/B and HFC components of the “new” NBN network will only ever be able to get what NBN Co delivers to them.

The issue…

Just to illustrate the issue here… For argument’s sake, you’re sitting at the fringes of a copper Distribution Area (DA) and your service gets peak speeds of 25/5 Mbps thanks to NBN Co’s“innovative” Vectored VDSL2+ FTTN rollout. Now, say in 2017… the company you work for has migrated to a cloud-based computing system that would greatly benefit from having burst capacity of 100/40Mbps so the internet doesn’t congest significantly when you start working. The problem is — no other competing network builder can come along and build a faster (and cheaper, especially in metro areas) fibre network for you — no matter how much you pay. Even small businesses can not get access to alternative “superfast carriage service” other than that provided by NBN Co.

Legal definition of Superfast
Defining superfast; 25/5Mbps is legally superfast under the Telecommuncations Act 1997

It works for an FTTP-dominated network

This framework was perfect under a universal and uniform fibre service that’s able to deliver services beyond the typical needs of a 2014-household. It keeps NBN Co’s monopoly and business case for cross-subsidy… and Australian residents and small businesses need not be worried by the restrictions of law on their ability to upgrade to higher and more reliable speeds since the GPON specification is future-proof with a backward-compatible XGPON upgrade path already available.

Just not FTTN…

But clearly, this does not work in an FTTN-dominated NBN. All residential and small businesses are legislatively bound in what their internet connection speeds achieve, that is, you will get at best what NBN Co is able to provide (a best-effort 25/5Mbps service). And if you think about it in the context of 2017 and beyond, that’s not a lot.

But without the current laws, NBN Co can’t possibly have a profitable business case. Its cross-subsidy plan for the rural fixed-line, fixed wireless and satellite services would crumble.

It’s a tough gig, but a self-inflicted gig

The Minister for Communications, Malcolm Turnbull, has a tough weight to balance. With the economical viability of NBN Co to struggle with, the party ideology of a free market and a self-imposed ideology of an FTTN network — one would wonder why we didn’t just stick with FTTP…

Disclaimer: this is based on my understanding of the Telecommunications Act 1997, Section 141B. Feel free to correct me if you believe what I’m asserting is incorrect — politely of course 😉